Singapore Airlines 2009 Annual Report Download - page 128
Download and view the complete annual report
Please find page 128 of the 2009 Singapore Airlines annual report below. You can navigate through the pages in the report by either clicking on the pages listed below, or by using the keyword search tool below to find specific information within the annual report.-
 1
1 -
2
-
3
-
4
-
5
-
6
-
7
-
8
-
9
-
10
-
11
-
12
-
13
-
14
-
15
-
16
-
17
-
18
-
19
-
20
-
21
-
22
-
23
-
24
-
25
-
26
-
27
-
28
-
29
-
30
-
31
-
32
-
33
-
34
-
35
-
36
-
37
-
38
-
39
-
40
-
41
-
42
-
43
-
44
-
45
-
46
-
47
-
48
-
49
-
50
-
51
-
52
-
53
-
54
-
55
-
56
-
57
-
58
-
59
-
60
-
61
-
62
-
63
-
64
-
65
-
66
-
67
-
68
-
69
-
70
-
71
-
72
-
73
-
74
-
75
-
76
-
77
-
78
-
79
-
80
-
81
-
82
-
83
-
84
-
85
-
86
-
87
-
88
-
89
-
90
-
91
-
92
-
93
-
94
-
95
-
96
-
97
-
98
-
99
-
100
-
101
-
102
-
103
-
104
-
105
-
106
-
107
-
108
-
109
-
110
-
111
-
112
-
113
-
114
-
115
-
116
-
117
-
 118
118 -
 119
119 -
 120
120 -
 121
121 -
 122
122 -
 123
123 -
 124
124 -
 125
125 -
 126
126 -
 127
127 -
 128
128 -
 129
129 -
 130
130 -
 131
131 -
 132
132 -
 133
133 -
 134
134 -
 135
135 -
 136
136 -
 137
137 -
 138
138 -
139
-
140
-
141
-
142
-
143
-
144
-
145
-
146
-
147
-
148
-
149
-
150
-
151
-
152
-
153
-
154
-
155
-
156
-
157
-
158
-
159
-
160
-
161
-
162
-
163
-
164
-
165
-
166
-
167
-
168
-
169
-
170
-
171
-
172
-
173
-
174
-
175
-
176
-
177
-
178
-
179
-
180
-
181
-
182
-
183
-
184
-
185
-
186
-
187
-
188
-
189
-
190
-
191
-
192
-
193
-
194
-
195
-
196
-
197
-
198
-
199
-
200
-
201
-
202
-
203
-
204
-
205
-
206
-
207
-
208
-
209
-
210
-
211
-
212
-
213
-
214
-
215
-
216
-
217
-
218
-
219
-
220
-
221
-
222
-
223
-
224
 |
 |

126
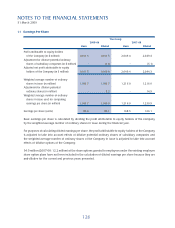
11 Earnings Per Share
The Group
2008-09 2007-08
Basic Diluted Basic Diluted
Profi t attributable to equity holders
of the Company (in $ million) 1,061.5 1,061.5 2,049.4 2,049.4
Adjustment for dilutive potential ordinary
shares of subsidiary companies (in $ million) - (1.1) - (5.1)
Adjusted net profi t attributable to equity
holders of the Company (in $ million) 1,061.5 1,060.4 2,049.4 2,044.3
Weighted average number of ordinary
shares in issue (in million) 1,184.7 1,184.7 1,216.0 1,216.0
Adjustment for dilutive potential
ordinary shares (in million) - 5.2 - 14.9
Weighted average number of ordinary
shares in issue used for computing
earnings per share (in million) 1,184.7 1,189.9 1,216.0 1,230.9
Earnings per share (cents) 89.6 89.1 168.5 166.1
Basic earnings per share is calculated by dividing the profi t attributable to equity holders of the Company
by the weighted average number of ordinary shares in issue during the fi nancial year.
For purposes of calculating diluted earnings per share, the profi t attributable to equity holders of the Company
is adjusted to take into account effects of dilutive potential ordinary shares of subsidiary companies and
the weighted average number of ordinary shares of the Company in issue is adjusted to take into account
effects of dilutive options of the Company.
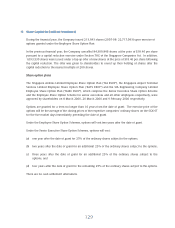
34.0 million (2007-08: 12.2 million) of the share options granted to employees under the existing employee
share option plans have not been included in the calculation of diluted earnings per share because they are
anti-dilutive for the current and previous years presented.
NOTES TO THE FINANCIAL STATEMENTS
31 March 2009