Singapore Airlines 2009 Annual Report Download - page 132
Download and view the complete annual report
Please find page 132 of the 2009 Singapore Airlines annual report below. You can navigate through the pages in the report by either clicking on the pages listed below, or by using the keyword search tool below to find specific information within the annual report.-
 1
1 -
2
-
3
-
4
-
5
-
6
-
7
-
8
-
9
-
10
-
11
-
12
-
13
-
14
-
15
-
16
-
17
-
18
-
19
-
20
-
21
-
22
-
23
-
24
-
25
-
26
-
27
-
28
-
29
-
30
-
31
-
32
-
33
-
34
-
35
-
36
-
37
-
38
-
39
-
40
-
41
-
42
-
43
-
44
-
45
-
46
-
47
-
48
-
49
-
50
-
51
-
52
-
53
-
54
-
55
-
56
-
57
-
58
-
59
-
60
-
61
-
62
-
63
-
64
-
65
-
66
-
67
-
68
-
69
-
70
-
71
-
72
-
73
-
74
-
75
-
76
-
77
-
78
-
79
-
80
-
81
-
82
-
83
-
84
-
85
-
86
-
87
-
88
-
89
-
90
-
91
-
92
-
93
-
94
-
95
-
96
-
97
-
98
-
99
-
100
-
101
-
102
-
103
-
104
-
105
-
106
-
107
-
108
-
109
-
110
-
111
-
112
-
113
-
114
-
115
-
116
-
117
-
118
-
119
-
120
-
121
-
 122
122 -
 123
123 -
 124
124 -
 125
125 -
 126
126 -
 127
127 -
 128
128 -
 129
129 -
 130
130 -
 131
131 -
 132
132 -
 133
133 -
 134
134 -
 135
135 -
 136
136 -
 137
137 -
 138
138 -
 139
139 -
 140
140 -
 141
141 -
 142
142 -
143
-
144
-
145
-
146
-
147
-
148
-
149
-
150
-
151
-
152
-
153
-
154
-
155
-
156
-
157
-
158
-
159
-
160
-
161
-
162
-
163
-
164
-
165
-
166
-
167
-
168
-
169
-
170
-
171
-
172
-
173
-
174
-
175
-
176
-
177
-
178
-
179
-
180
-
181
-
182
-
183
-
184
-
185
-
186
-
187
-
188
-
189
-
190
-
191
-
192
-
193
-
194
-
195
-
196
-
197
-
198
-
199
-
200
-
201
-
202
-
203
-
204
-
205
-
206
-
207
-
208
-
209
-
210
-
211
-
212
-
213
-
214
-
215
-
216
-
217
-
218
-
219
-
220
-
221
-
222
-
223
-
224
 |
 |

130
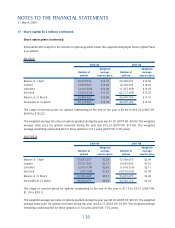
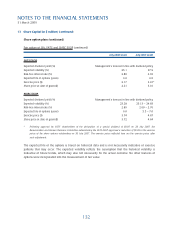
13 Share Capital (in $ million) (continued)
Share option plans (continued)
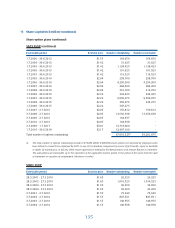
Information with respect to the number of options granted under the respective Employee Share Option Plans
is as follows:
SIA ESOP
2008-09 2007-08
Weighted Weighted
Number of average Number of average
options exercise price options exercise price
Balance at 1 April 56,670,796 $13.53 68,338,907 $12.96
Granted 12,836,062 $14.83 12,324,345 $18.22
Cancelled (2,491,890) $14.28 (1,275,363) $13.95
Exercised (3,631,476) $11.51 (22,717,093) $13.25
Balance at 31 March 63,383,492 $13.88 56,670,796 $13.53
Exercisable at 31 March 36,174,505 $12.57 29,277,185 $12.59
The range of exercise prices for options outstanding at the end of the year is $9.84 to $18.22 (2007-08:
$9.84 to $18.22).
The weighted average fair value of options granted during the year was $1.95 (2007-08: $4.56). The weighted
average share price for options exercised during the year was $13.23 (2007-08: $17.85). The weighted
average remaining contractual life for these options is 6.21 years (2007-08: 6.38 years).
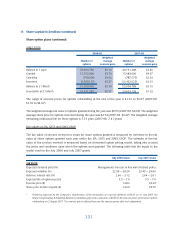
SATS ESOP
2008-09 2007-08
Weighted Weighted
Number of average Number of average
options exercise price options exercise price
Balance at 1 April 55,873,275 $2.28 57,508,655 $2.04
Granted 13,517,300 $2.17 14,093,000 $3.01
Cancelled (2,031,550) $2.02 (1,018,320) $2.11
Exercised (357,700) $1.92 (14,710,060) $2.04
Balance at 31 March 67,001,325 $2.27 55,873,275 $2.28
Exercisable at 31 March 39,201,075 $2.04 26,550,137 $2.03
The range of exercise prices for options outstanding at the end of the year is $1.19 to $3.01 (2007-08:
$1.19 to $3.01).
The weighted average fair value of options granted during the year was $0.36 (2007-09: $0.72). The weighted
average share price for options exercised during the year was $2.17 (2007-08: $3.09). The weighted average
remaining contractual life for these options is 6.74 years (2007-08: 7.02 years).
NOTES TO THE FINANCIAL STATEMENTS
31 March 2009