Singapore Airlines 2009 Annual Report Download - page 141
Download and view the complete annual report
Please find page 141 of the 2009 Singapore Airlines annual report below. You can navigate through the pages in the report by either clicking on the pages listed below, or by using the keyword search tool below to find specific information within the annual report.-
 1
1 -
2
-
3
-
4
-
5
-
6
-
7
-
8
-
9
-
10
-
11
-
12
-
13
-
14
-
15
-
16
-
17
-
18
-
19
-
20
-
21
-
22
-
23
-
24
-
25
-
26
-
27
-
28
-
29
-
30
-
31
-
32
-
33
-
34
-
35
-
36
-
37
-
38
-
39
-
40
-
41
-
42
-
43
-
44
-
45
-
46
-
47
-
48
-
49
-
50
-
51
-
52
-
53
-
54
-
55
-
56
-
57
-
58
-
59
-
60
-
61
-
62
-
63
-
64
-
65
-
66
-
67
-
68
-
69
-
70
-
71
-
72
-
73
-
74
-
75
-
76
-
77
-
78
-
79
-
80
-
81
-
82
-
83
-
84
-
85
-
86
-
87
-
88
-
89
-
90
-
91
-
92
-
93
-
94
-
95
-
96
-
97
-
98
-
99
-
100
-
101
-
102
-
103
-
104
-
105
-
106
-
107
-
108
-
109
-
110
-
111
-
112
-
113
-
114
-
115
-
116
-
117
-
118
-
119
-
120
-
121
-
122
-
123
-
124
-
125
-
126
-
127
-
128
-
129
-
130
-
 131
131 -
 132
132 -
 133
133 -
 134
134 -
 135
135 -
 136
136 -
 137
137 -
 138
138 -
 139
139 -
 140
140 -
 141
141 -
 142
142 -
 143
143 -
 144
144 -
 145
145 -
 146
146 -
 147
147 -
 148
148 -
 149
149 -
 150
150 -
 151
151 -
152
-
153
-
154
-
155
-
156
-
157
-
158
-
159
-
160
-
161
-
162
-
163
-
164
-
165
-
166
-
167
-
168
-
169
-
170
-
171
-
172
-
173
-
174
-
175
-
176
-
177
-
178
-
179
-
180
-
181
-
182
-
183
-
184
-
185
-
186
-
187
-
188
-
189
-
190
-
191
-
192
-
193
-
194
-
195
-
196
-
197
-
198
-
199
-
200
-
201
-
202
-
203
-
204
-
205
-
206
-
207
-
208
-
209
-
210
-
211
-
212
-
213
-
214
-
215
-
216
-
217
-
218
-
219
-
220
-
221
-
222
-
223
-
224
 |
 |

139
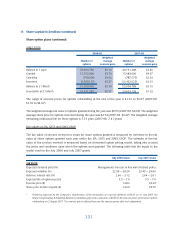
13 Share Capital (in $ million) (continued)
Share-based incentive plans (continued)
Fair values of RSP and PSP (continued)
SIA RSP and PSP (continued)
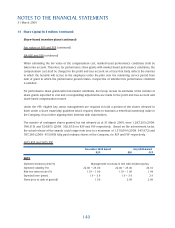
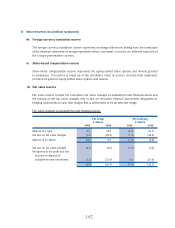
For non-market conditions, achievement factors are determined based on inputs from the Board
Compensation & Industrial Relations Committee for the purpose of accrual for the RSP until the achievement
of the targets can be accurately ascertained.
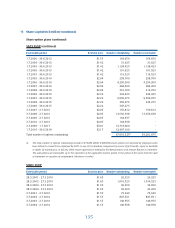
The details of the shares awarded under the new share plans during the year since commencement of the
RSP and PSP are as follows:
Number of Restricted shares
Balance at
1.4.2008 / date Balance at
Date of grant of grant Adjustment * Vested Cancelled 31.3.2009
RSP
27.7.2006 260,505 41,226 (152,969) (9,013) 139,749
1.8.2007 527,805 - - (30,963) 496,842
1.7.2008 676,424 - - (25,812) 650,612
1,464,734 41,226 (152,969) (65,788) 1,287,203
* Adjustment at the end of two-year performance period upon meeting stated performance targets.
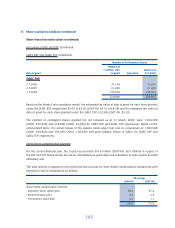
Number of Performance shares
Balance at
1.4.2008 / date Balance at
Date of grant of grant Cancelled 31.3.2009
PSP
27.7.2006 144,701 - 144,701
1.8.2007 157,952 - 157,952
1.7.2008 222,200 - 222,200
524,853 - 524,853
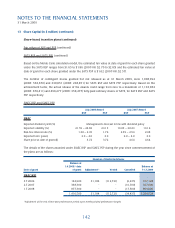
Based on the Monte Carlo simulation model, the estimated fair value at date of grant for each share granted
under the RSP ranges from $11.21 to $12.72 (2007-08: $17.24 to $18.04) and the estimated fair value at
date of grant for each share granted under the PSP is $9.62 (2007-08: $15.53).