Singapore Airlines 2009 Annual Report Download - page 68
Download and view the complete annual report
Please find page 68 of the 2009 Singapore Airlines annual report below. You can navigate through the pages in the report by either clicking on the pages listed below, or by using the keyword search tool below to find specific information within the annual report.-
 1
1 -
2
-
3
-
4
-
5
-
6
-
7
-
8
-
9
-
10
-
11
-
12
-
13
-
14
-
15
-
16
-
17
-
18
-
19
-
20
-
21
-
22
-
23
-
24
-
25
-
26
-
27
-
28
-
29
-
30
-
31
-
32
-
33
-
34
-
35
-
36
-
37
-
38
-
39
-
40
-
41
-
42
-
43
-
44
-
45
-
46
-
47
-
48
-
49
-
50
-
51
-
52
-
53
-
54
-
55
-
56
-
57
-
 58
58 -
 59
59 -
 60
60 -
 61
61 -
 62
62 -
 63
63 -
 64
64 -
 65
65 -
 66
66 -
 67
67 -
 68
68 -
 69
69 -
 70
70 -
 71
71 -
 72
72 -
 73
73 -
 74
74 -
 75
75 -
 76
76 -
 77
77 -
 78
78 -
79
-
80
-
81
-
82
-
83
-
84
-
85
-
86
-
87
-
88
-
89
-
90
-
91
-
92
-
93
-
94
-
95
-
96
-
97
-
98
-
99
-
100
-
101
-
102
-
103
-
104
-
105
-
106
-
107
-
108
-
109
-
110
-
111
-
112
-
113
-
114
-
115
-
116
-
117
-
118
-
119
-
120
-
121
-
122
-
123
-
124
-
125
-
126
-
127
-
128
-
129
-
130
-
131
-
132
-
133
-
134
-
135
-
136
-
137
-
138
-
139
-
140
-
141
-
142
-
143
-
144
-
145
-
146
-
147
-
148
-
149
-
150
-
151
-
152
-
153
-
154
-
155
-
156
-
157
-
158
-
159
-
160
-
161
-
162
-
163
-
164
-
165
-
166
-
167
-
168
-
169
-
170
-
171
-
172
-
173
-
174
-
175
-
176
-
177
-
178
-
179
-
180
-
181
-
182
-
183
-
184
-
185
-
186
-
187
-
188
-
189
-
190
-
191
-
192
-
193
-
194
-
195
-
196
-
197
-
198
-
199
-
200
-
201
-
202
-
203
-
204
-
205
-
206
-
207
-
208
-
209
-
210
-
211
-
212
-
213
-
214
-
215
-
216
-
217
-
218
-
219
-
220
-
221
-
222
-
223
-
224
 |
 |

66
Performance of Subsidiary Companies (continued)
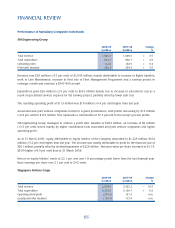
SIA Engineering Group
2008-09 2007-08 Change
$ million $ million %
Total revenue 1,045.3 1,009.6 + 3.5
Total expenditure 932.7 906.7 + 2.9
Operating profi t 112.6 102.9 + 9.4
Profi t after taxation 263.3 254.3 + 3.5
Revenue rose $36 million (+3.5 per cent) to $1,045 million, mainly attributable to increase in fl ights handled,
work in Line Maintenance, increase in fl eet size of Fleet Management Programme and a turnkey project to
redesign, retrofi t and overhaul a B747-400 aircraft.
Expenditure grew $26 million (+2.9 per cent) to $933 million mainly due to increase in subcontract cost as a
result of specialised services required for the turnkey project, partially offset by lower staff cost.
The resulting operating profi t of $113 million was $10 million (+9.4 per cent) higher than last year.
Associated and joint venture companies turned in a good performance, with profi ts increasing by $15 million
(+9.6 per cent) to $173 million. This represents a contribution of 57.5 percent to the Group’s pre-tax profi ts.
SIA Engineering Group managed to achieve a profi t after taxation of $263 million, an increase of $9 million
(+3.5 per cent), driven mainly by higher contribution from associated and joint venture companies and higher
operating profi t.
As at 31 March 2009, equity attributable to equity holders of the Company amounted to $1,229 million, $104
million (+9.2 per cent) higher than last year. The increase was mainly attributable to profi t for the fi nancial year of
$261 million, partially offset by dividend payments of $226 million. Net asset value per share increased to $1.14,
$0.09 higher (+8.9 per cent) than at 31 March 2008.
Return on equity holders’ funds at 22.1 per cent was 1.8 percentage points lower than the last fi nancial year.
Basic earnings per share rose 2.1 per cent to 24.2 cents.
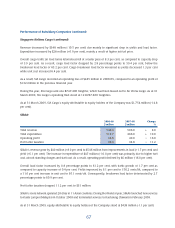
Singapore Airlines Cargo
2008-09 2007-08 Change
$ million $ million %
Total revenue 2,974.0 3,322.2 – 10.5
Total expenditure 3,219.0 3,190.7 + 0.9
Operating (loss)/profi t (245.0) 131.5 n.m.
(Loss)/profi t after taxation (153.9) 115.4 n.m.
FINANCIAL REVIEW