Singapore Airlines 2009 Annual Report Download - page 58
Download and view the complete annual report
Please find page 58 of the 2009 Singapore Airlines annual report below. You can navigate through the pages in the report by either clicking on the pages listed below, or by using the keyword search tool below to find specific information within the annual report.-
 1
1 -
2
-
3
-
4
-
5
-
6
-
7
-
8
-
9
-
10
-
11
-
12
-
13
-
14
-
15
-
16
-
17
-
18
-
19
-
20
-
21
-
22
-
23
-
24
-
25
-
26
-
27
-
28
-
29
-
30
-
31
-
32
-
33
-
34
-
35
-
36
-
37
-
38
-
39
-
40
-
41
-
42
-
43
-
44
-
45
-
46
-
47
-
 48
48 -
 49
49 -
 50
50 -
 51
51 -
 52
52 -
 53
53 -
 54
54 -
 55
55 -
 56
56 -
 57
57 -
 58
58 -
 59
59 -
 60
60 -
 61
61 -
 62
62 -
 63
63 -
 64
64 -
 65
65 -
 66
66 -
 67
67 -
 68
68 -
69
-
70
-
71
-
72
-
73
-
74
-
75
-
76
-
77
-
78
-
79
-
80
-
81
-
82
-
83
-
84
-
85
-
86
-
87
-
88
-
89
-
90
-
91
-
92
-
93
-
94
-
95
-
96
-
97
-
98
-
99
-
100
-
101
-
102
-
103
-
104
-
105
-
106
-
107
-
108
-
109
-
110
-
111
-
112
-
113
-
114
-
115
-
116
-
117
-
118
-
119
-
120
-
121
-
122
-
123
-
124
-
125
-
126
-
127
-
128
-
129
-
130
-
131
-
132
-
133
-
134
-
135
-
136
-
137
-
138
-
139
-
140
-
141
-
142
-
143
-
144
-
145
-
146
-
147
-
148
-
149
-
150
-
151
-
152
-
153
-
154
-
155
-
156
-
157
-
158
-
159
-
160
-
161
-
162
-
163
-
164
-
165
-
166
-
167
-
168
-
169
-
170
-
171
-
172
-
173
-
174
-
175
-
176
-
177
-
178
-
179
-
180
-
181
-
182
-
183
-
184
-
185
-
186
-
187
-
188
-
189
-
190
-
191
-
192
-
193
-
194
-
195
-
196
-
197
-
198
-
199
-
200
-
201
-
202
-
203
-
204
-
205
-
206
-
207
-
208
-
209
-
210
-
211
-
212
-
213
-
214
-
215
-
216
-
217
-
218
-
219
-
220
-
221
-
222
-
223
-
224
 |
 |
56
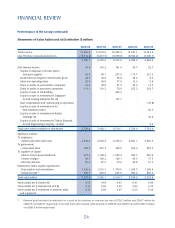
Performance of the Group (continued)
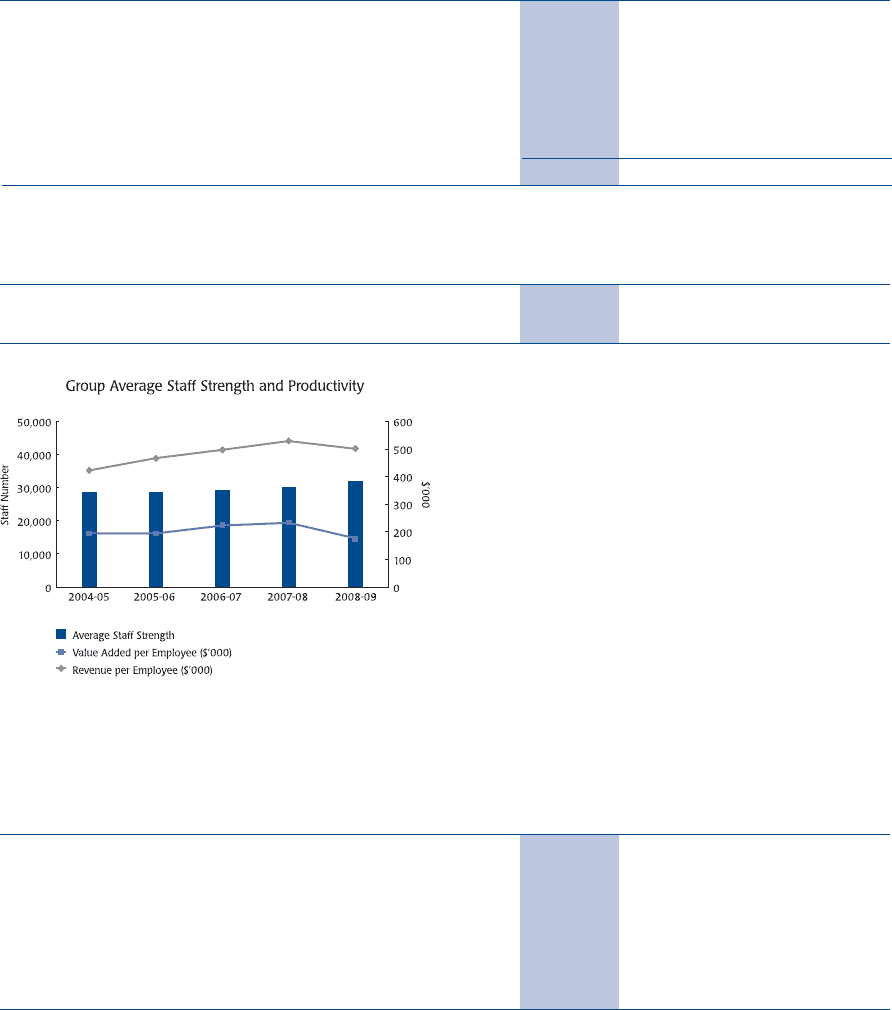
Group Average Staff Strength and Productivity
The Group’s average staff strength increased by 1,746 to 31,834 employees. A breakdown is as follows:
2008-09 2007-08 % Change
Singapore Airlines 14,343 14,071 + 1.9
Singapore Airport Terminal Services Group 8,968 7,700 + 16.5
SIA Engineering Group 6,259 6,116 + 2.3
Singapore Airlines Cargo 1,085 1,096 – 1.0
SilkAir 876 798 + 9.8
Others 303 307 – 1.3
31,834 30,088 + 5.8
Average staff productivity are as follows:
2008-09 2007-08 % Change
Revenue per employee ($) 502,491 530,859 – 5.3
Value added per employee ($) 174,995 235,380 – 25.7
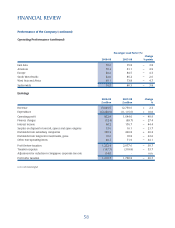
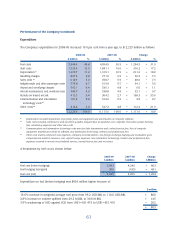
Performance of the Company
Operating Performance
2008-09 2007-08 % Change
Passengers carried (thousand) 18,293 19,120 – 4.3
Available seat-km (million) 117,788.7 113,919.1 + 3.4
Revenue passenger-km (million) 90,128.1 91,485.2 – 1.5
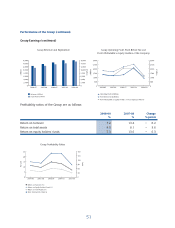
Passenger load factor (%) 76.5 80.3 – 3.8 points
Passenger yield (¢/pkm) 12.5 12.1 + 3.3
Passenger unit cost (¢/ask) 9.2 8.4 + 9.5
Passenger breakeven load factor (%) 73.6 69.4 + 4.2 points
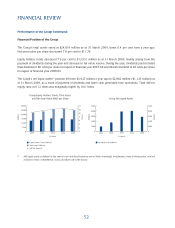
FINANCIAL REVIEW