Singapore Airlines 2009 Annual Report Download - page 144
Download and view the complete annual report
Please find page 144 of the 2009 Singapore Airlines annual report below. You can navigate through the pages in the report by either clicking on the pages listed below, or by using the keyword search tool below to find specific information within the annual report.-
 1
1 -
2
-
3
-
4
-
5
-
6
-
7
-
8
-
9
-
10
-
11
-
12
-
13
-
14
-
15
-
16
-
17
-
18
-
19
-
20
-
21
-
22
-
23
-
24
-
25
-
26
-
27
-
28
-
29
-
30
-
31
-
32
-
33
-
34
-
35
-
36
-
37
-
38
-
39
-
40
-
41
-
42
-
43
-
44
-
45
-
46
-
47
-
48
-
49
-
50
-
51
-
52
-
53
-
54
-
55
-
56
-
57
-
58
-
59
-
60
-
61
-
62
-
63
-
64
-
65
-
66
-
67
-
68
-
69
-
70
-
71
-
72
-
73
-
74
-
75
-
76
-
77
-
78
-
79
-
80
-
81
-
82
-
83
-
84
-
85
-
86
-
87
-
88
-
89
-
90
-
91
-
92
-
93
-
94
-
95
-
96
-
97
-
98
-
99
-
100
-
101
-
102
-
103
-
104
-
105
-
106
-
107
-
108
-
109
-
110
-
111
-
112
-
113
-
114
-
115
-
116
-
117
-
118
-
119
-
120
-
121
-
122
-
123
-
124
-
125
-
126
-
127
-
128
-
129
-
130
-
131
-
132
-
133
-
 134
134 -
 135
135 -
 136
136 -
 137
137 -
 138
138 -
 139
139 -
 140
140 -
 141
141 -
 142
142 -
 143
143 -
 144
144 -
 145
145 -
 146
146 -
 147
147 -
 148
148 -
 149
149 -
 150
150 -
 151
151 -
 152
152 -
 153
153 -
 154
154 -
155
-
156
-
157
-
158
-
159
-
160
-
161
-
162
-
163
-
164
-
165
-
166
-
167
-
168
-
169
-
170
-
171
-
172
-
173
-
174
-
175
-
176
-
177
-
178
-
179
-
180
-
181
-
182
-
183
-
184
-
185
-
186
-
187
-
188
-
189
-
190
-
191
-
192
-
193
-
194
-
195
-
196
-
197
-
198
-
199
-
200
-
201
-
202
-
203
-
204
-
205
-
206
-
207
-
208
-
209
-
210
-
211
-
212
-
213
-
214
-
215
-
216
-
217
-
218
-
219
-
220
-
221
-
222
-
223
-
224
 |
 |

142
NOTES TO THE FINANCIAL STATEMENTS
31 March 2009
13 Share Capital (in $ million) (continued)
Share-based incentive plans (continued)
Fair values of RSP and PSP (continued)
SATS RSP and SATS PSP (continued)
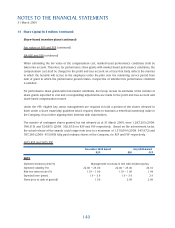
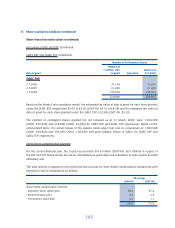
Based on the Monte Carlo simulation model, the estimated fair value at date of grant for each share granted
under the SATS RSP ranges from $1.65 to $1.86 (2007-08: $2.70 to $2.85) and the estimated fair value at
date of grant for each share granted under the SATS PSP is $1.62 (2007-08: $2.57).
The number of contingent shares granted but not released as at 31 March 2009, were 1,008,994
(2008: 563,676) and 330,851 (2008: 238,851) for SATS RSP and SATS PSP respectively. Based on the
achievement factor, the actual release of the awards could range from zero to a maximum of 1,193,984
(2008: 676,411) and 496,277 (2008: 358,277) fully-paid ordinary shares of SATS, for SATS RSP and SATS
PSP respectively.
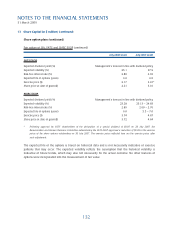
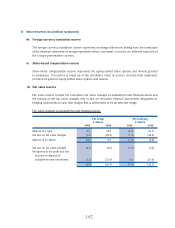
SIAEC RSP and SIAEC PSP
July 2008 Award July 2007 Award
RSP PSP RSP PSP
SIAEC
Expected dividend yield (%) Management’s forecast in line with dividend policy
Expected volatility (%) 21.59 – 24.82 23.15 19.05 – 20.43 19.16
Risk-free interest rate (%) 1.30 – 2.35 1.76 2.39 – 2.54 2.48
Expected term (years) 2.0 – 4.0 3.0 2.0 – 4.0 3.0
Share price at date of grant ($) 3.72 3.72 4.64 4.64
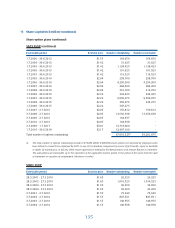
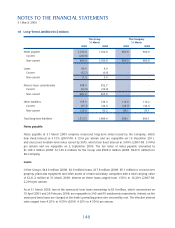
The details of the shares awarded under SIAEC RSP and SIAEC PSP during the year since commencement of
the plans are as follows:
Number of Restricted shares
Balance at
1.4.2008 / date Balance at
Date of grant of grant Adjustment * Vested Cancelled 31.3.2009
SIAEC RSP
3.7.2006 194,900 31,184 (112,721) (6,235) 107,128
2.7.2007 338,300 - - (10,700) 327,600
1.7.2008 877,300 - - (17,500) 859,800
1,410,500 31,184 (112,721) (34,435) 1,294,528
* Adjustment at the end of two-year performance period upon meeting stated performance targets.