Singapore Airlines 2009 Annual Report Download - page 210
Download and view the complete annual report
Please find page 210 of the 2009 Singapore Airlines annual report below. You can navigate through the pages in the report by either clicking on the pages listed below, or by using the keyword search tool below to find specific information within the annual report.-
 1
1 -
2
-
3
-
4
-
5
-
6
-
7
-
8
-
9
-
10
-
11
-
12
-
13
-
14
-
15
-
16
-
17
-
18
-
19
-
20
-
21
-
22
-
23
-
24
-
25
-
26
-
27
-
28
-
29
-
30
-
31
-
32
-
33
-
34
-
35
-
36
-
37
-
38
-
39
-
40
-
41
-
42
-
43
-
44
-
45
-
46
-
47
-
48
-
49
-
50
-
51
-
52
-
53
-
54
-
55
-
56
-
57
-
58
-
59
-
60
-
61
-
62
-
63
-
64
-
65
-
66
-
67
-
68
-
69
-
70
-
71
-
72
-
73
-
74
-
75
-
76
-
77
-
78
-
79
-
80
-
81
-
82
-
83
-
84
-
85
-
86
-
87
-
88
-
89
-
90
-
91
-
92
-
93
-
94
-
95
-
96
-
97
-
98
-
99
-
100
-
101
-
102
-
103
-
104
-
105
-
106
-
107
-
108
-
109
-
110
-
111
-
112
-
113
-
114
-
115
-
116
-
117
-
118
-
119
-
120
-
121
-
122
-
123
-
124
-
125
-
126
-
127
-
128
-
129
-
130
-
131
-
132
-
133
-
134
-
135
-
136
-
137
-
138
-
139
-
140
-
141
-
142
-
143
-
144
-
145
-
146
-
147
-
148
-
149
-
150
-
151
-
152
-
153
-
154
-
155
-
156
-
157
-
158
-
159
-
160
-
161
-
162
-
163
-
164
-
165
-
166
-
167
-
168
-
169
-
170
-
171
-
172
-
173
-
174
-
175
-
176
-
177
-
178
-
179
-
180
-
181
-
182
-
183
-
184
-
185
-
186
-
187
-
188
-
189
-
190
-
191
-
192
-
193
-
194
-
195
-
196
-
197
-
198
-
199
-
 200
200 -
 201
201 -
 202
202 -
 203
203 -
 204
204 -
 205
205 -
 206
206 -
 207
207 -
 208
208 -
 209
209 -
 210
210 -
 211
211 -
 212
212 -
 213
213 -
 214
214 -
 215
215 -
 216
216 -
 217
217 -
 218
218 -
 219
219 -
 220
220 -
221
-
222
-
223
-
224
 |
 |

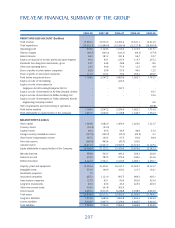
208
2008-09 2007-08 2006-07 2005-06 2004-05
CASH FLOW ($ million)
Cash fl ow from operations 1,745.4 4,401.8 3,175.8 2,380.3 2,853.3
Internally generated cash fl ow R1 2,773.0 5,028.3 4,823.0 3,101.2 3,990.2
Capital expenditure 2,031.1 2,088.6 3,026.7 2,058.8 2,068.1
PER SHARE DATA
Earnings before tax (cents) 101.2 209.5 185.2 136.3 147.0
Earnings after tax (cents) - basic 89.6 168.5 172.6 101.7 111.0
- diluted 89.1 166.1 170.8 101.3 111.0
Cash earnings ($) R2 2.36 2.94 2.84 2.08 2.10
Net asset value ($) 11.78 12.77 12.11 11.00 10.13
SHARE PRICE ($)
High 16.34 20.20 18.00 14.90 12.70
Low 9.39 14.12 12.00 11.10 9.40
Closing 10.00 15.60 16.60 14.00 11.90
DIVIDENDS
Gross dividends (cents per share) 40.0 100.0 100.0 R3 45.0 40.0
Dividend cover (times) 2.2 1.7 1.7 2.3 2.8
PROFITABILITY RATIOS (%)
Return on equity holders’ funds R4 7.3 13.6 14.9 9.6 11.4
Return on total assets R5 4.5 8.1 8.9 5.8 6.7
Return on turnover R6 7.2 13.4 15.2 9.8 11.7
PRODUCTIVITY AND EMPLOYEE DATA
Value added ($ million) 5,570.8 7,082.1 6,510.1 5,534.0 5,533.6
Value added per employee ($) R7 174,995 235,380 223,523 193,781 193,794
Revenue per employee ($) R7 502,491 530,859 497,662 467,158 420,708
Average employee strength 31,834 30,088 29,125 28,558 28,554
S$ per US$ exchange rate as at 31 March 1.5203 1.3807 1.5171 1.6181 1.6496
R1 Internally generated cash fl ow comprises cash generated from operations, dividends from joint venture and associated companies,
and proceeds from sale of aircraft and other property, plant and equipment.
R2 Cash earnings is defi ned as profi t attributable to equity holders of the Company plus depreciation and amortisation.
R3 Includes 50.0 cents per share special dividend.
R4 Return on equity holders’ funds is the profi t attributable to equity holders of the Company expressed as a percentage of the
average equity holders’ funds.
R5 Return on total assets is the profi t after tax expressed as a percentage of the average total assets.
R6 Return on turnover is the profi t after tax expressed as a percentage of the total revenue.
R7 Based on average staff strength.
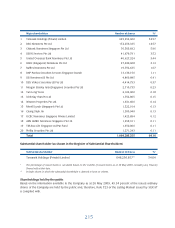
FIVE-YEAR FINANCIAL SUMMARY OF THE GROUP