Singapore Airlines 2009 Annual Report Download - page 187
Download and view the complete annual report
Please find page 187 of the 2009 Singapore Airlines annual report below. You can navigate through the pages in the report by either clicking on the pages listed below, or by using the keyword search tool below to find specific information within the annual report.-
 1
1 -
2
-
3
-
4
-
5
-
6
-
7
-
8
-
9
-
10
-
11
-
12
-
13
-
14
-
15
-
16
-
17
-
18
-
19
-
20
-
21
-
22
-
23
-
24
-
25
-
26
-
27
-
28
-
29
-
30
-
31
-
32
-
33
-
34
-
35
-
36
-
37
-
38
-
39
-
40
-
41
-
42
-
43
-
44
-
45
-
46
-
47
-
48
-
49
-
50
-
51
-
52
-
53
-
54
-
55
-
56
-
57
-
58
-
59
-
60
-
61
-
62
-
63
-
64
-
65
-
66
-
67
-
68
-
69
-
70
-
71
-
72
-
73
-
74
-
75
-
76
-
77
-
78
-
79
-
80
-
81
-
82
-
83
-
84
-
85
-
86
-
87
-
88
-
89
-
90
-
91
-
92
-
93
-
94
-
95
-
96
-
97
-
98
-
99
-
100
-
101
-
102
-
103
-
104
-
105
-
106
-
107
-
108
-
109
-
110
-
111
-
112
-
113
-
114
-
115
-
116
-
117
-
118
-
119
-
120
-
121
-
122
-
123
-
124
-
125
-
126
-
127
-
128
-
129
-
130
-
131
-
132
-
133
-
134
-
135
-
136
-
137
-
138
-
139
-
140
-
141
-
142
-
143
-
144
-
145
-
146
-
147
-
148
-
149
-
150
-
151
-
152
-
153
-
154
-
155
-
156
-
157
-
158
-
159
-
160
-
161
-
162
-
163
-
164
-
165
-
166
-
167
-
168
-
169
-
170
-
171
-
172
-
173
-
174
-
175
-
176
-
 177
177 -
 178
178 -
 179
179 -
 180
180 -
 181
181 -
 182
182 -
 183
183 -
 184
184 -
 185
185 -
 186
186 -
 187
187 -
 188
188 -
 189
189 -
 190
190 -
 191
191 -
 192
192 -
 193
193 -
 194
194 -
 195
195 -
 196
196 -
 197
197 -
198
-
199
-
200
-
201
-
202
-
203
-
204
-
205
-
206
-
207
-
208
-
209
-
210
-
211
-
212
-
213
-
214
-
215
-
216
-
217
-
218
-
219
-
220
-
221
-
222
-
223
-
224
 |
 |

185
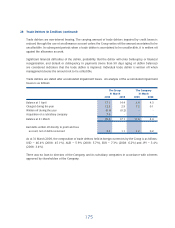
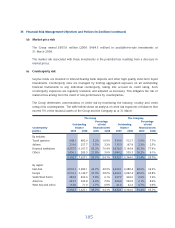
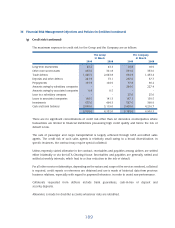
36 Financial Risk Management Objectives and Policies (in $ million) (continued)
(d) Market price risk
The Group owned $655.6 million (2008: $464.3 million) in available-for-sale investments at
31 March 2009.
The market risk associated with these investments is the potential loss resulting from a decrease in
market prices.
(e) Counterparty risk
Surplus funds are invested in interest-bearing bank deposits and other high quality short-term liquid
investments. Counterparty risks are managed by limiting aggregated exposure on all outstanding
fi nancial instruments to any individual counterparty, taking into account its credit rating. Such
counterparty exposures are regularly reviewed, and adjusted as necessary. This mitigates the risk of
material loss arising from the event of non-performance by counterparties.
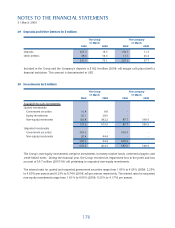
The Group determines concentrations of credit risk by monitoring the industry, country and credit
rating of its counterparties. The table below shows an analysis of credit risk exposures of balances that
exceed 5% of the fi nancial assets of the Group and the Company as at 31 March:
The Group The Company
Percentage Percentage
Outstanding of total Outstanding of total
Counterparty balance fi nancial assets balance fi nancial assets
profi les 2009 2008 2009 2008 2009 2008 2009 2008
By industry:
Travel agencies 348.1 882.0 5.2% 10.9% 334.6 512.7 5.6% 7.7%
Airlines 231.0 257.7 3.5% 3.2% 135.3 167.8 2.3% 2.5%
Financial institutions 4,357.5 6,197.5 65.2% 76.4% 3,878.0 5,144.8 65.3% 77.4%
Others 1,456.1 289.9 21.8% 3.6% 1,084.2 539.3 18.2% 8.1%
6,392.7 7,627.1 95.7% 94.1% 5,432.1 6,364.6 91.4% 95.7%
By region:
East Asia 2,918.1 3,282.1 43.7% 40.5% 2,259.1 2,280.4 38.0% 34.3%
Europe 2,531.1 3,140.7 37.9% 38.7% 2,409.1 3,047.4 40.6% 45.8%
South West Pacifi c 388.8 492.6 5.8% 6.1% 357.7 464.6 6.0% 7.0%
Americas 442.7 639.8 6.6% 7.9% 364.6 529.8 6.1% 8.0%
West Asia and Africa 112.0 71.9 1.7% 0.9% 41.6 42.4 0.7% 0.6%
6,392.7 7,627.1 95.7% 94.1% 5,432.1 6,364.6 91.4% 95.7%