Singapore Airlines 2009 Annual Report Download - page 66
Download and view the complete annual report
Please find page 66 of the 2009 Singapore Airlines annual report below. You can navigate through the pages in the report by either clicking on the pages listed below, or by using the keyword search tool below to find specific information within the annual report.-
 1
1 -
2
-
3
-
4
-
5
-
6
-
7
-
8
-
9
-
10
-
11
-
12
-
13
-
14
-
15
-
16
-
17
-
18
-
19
-
20
-
21
-
22
-
23
-
24
-
25
-
26
-
27
-
28
-
29
-
30
-
31
-
32
-
33
-
34
-
35
-
36
-
37
-
38
-
39
-
40
-
41
-
42
-
43
-
44
-
45
-
46
-
47
-
48
-
49
-
50
-
51
-
52
-
53
-
54
-
55
-
 56
56 -
 57
57 -
 58
58 -
 59
59 -
 60
60 -
 61
61 -
 62
62 -
 63
63 -
 64
64 -
 65
65 -
 66
66 -
 67
67 -
 68
68 -
 69
69 -
 70
70 -
 71
71 -
 72
72 -
 73
73 -
 74
74 -
 75
75 -
 76
76 -
77
-
78
-
79
-
80
-
81
-
82
-
83
-
84
-
85
-
86
-
87
-
88
-
89
-
90
-
91
-
92
-
93
-
94
-
95
-
96
-
97
-
98
-
99
-
100
-
101
-
102
-
103
-
104
-
105
-
106
-
107
-
108
-
109
-
110
-
111
-
112
-
113
-
114
-
115
-
116
-
117
-
118
-
119
-
120
-
121
-
122
-
123
-
124
-
125
-
126
-
127
-
128
-
129
-
130
-
131
-
132
-
133
-
134
-
135
-
136
-
137
-
138
-
139
-
140
-
141
-
142
-
143
-
144
-
145
-
146
-
147
-
148
-
149
-
150
-
151
-
152
-
153
-
154
-
155
-
156
-
157
-
158
-
159
-
160
-
161
-
162
-
163
-
164
-
165
-
166
-
167
-
168
-
169
-
170
-
171
-
172
-
173
-
174
-
175
-
176
-
177
-
178
-
179
-
180
-
181
-
182
-
183
-
184
-
185
-
186
-
187
-
188
-
189
-
190
-
191
-
192
-
193
-
194
-
195
-
196
-
197
-
198
-
199
-
200
-
201
-
202
-
203
-
204
-
205
-
206
-
207
-
208
-
209
-
210
-
211
-
212
-
213
-
214
-
215
-
216
-
217
-
218
-
219
-
220
-
221
-
222
-
223
-
224
 |
 |

64
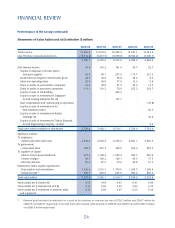
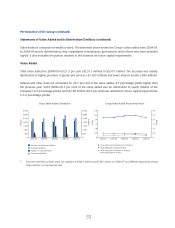
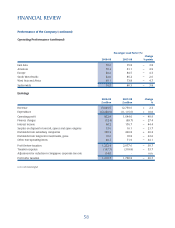
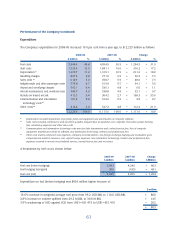
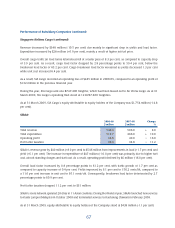
Performance of the Company (continued)
Average Staff Strength and Productivity
The Company’s average staff strength was 14,343, an increase of 272 over last year. The distribution of employee
strength by category and location is as follows:
2008-09 2007-08 % Change
Category
Senior staff (administrative and higher ranking offi cers) 1,327 1,325 + 0.2
Technical crew 2,299 2,212 + 3.9
Cabin crew 7,303 7,043 + 3.7
Other ground staff 3,414 3,491 – 2.2
14,343 14,071 + 1.9
Location
Singapore 12,206 11,885 + 2.7
East Asia 898 936 – 4.1
Europe 407 404 + 0.7
South West Pacifi c 328 350 – 6.3
West Asia and Africa 301 278 + 8.3
Americas 203 218 – 6.9
14,343 14,071 + 1.9
The Company’s average staff productivity ratios are shown below:
2008-09 2007-08 % Change
Seat capacity per employee (seat-km) 8,212,278 8,096,020 + 1.4
Passenger load carried per employee (tonne-km) 598,047 618,295 – 3.3
Revenue per employee ($) 909,817 906,801 + 0.3
Value added per employee ($) 294,666 368,382 – 20.0
FINANCIAL REVIEW