Singapore Airlines 2009 Annual Report Download - page 209
Download and view the complete annual report
Please find page 209 of the 2009 Singapore Airlines annual report below. You can navigate through the pages in the report by either clicking on the pages listed below, or by using the keyword search tool below to find specific information within the annual report.-
 1
1 -
2
-
3
-
4
-
5
-
6
-
7
-
8
-
9
-
10
-
11
-
12
-
13
-
14
-
15
-
16
-
17
-
18
-
19
-
20
-
21
-
22
-
23
-
24
-
25
-
26
-
27
-
28
-
29
-
30
-
31
-
32
-
33
-
34
-
35
-
36
-
37
-
38
-
39
-
40
-
41
-
42
-
43
-
44
-
45
-
46
-
47
-
48
-
49
-
50
-
51
-
52
-
53
-
54
-
55
-
56
-
57
-
58
-
59
-
60
-
61
-
62
-
63
-
64
-
65
-
66
-
67
-
68
-
69
-
70
-
71
-
72
-
73
-
74
-
75
-
76
-
77
-
78
-
79
-
80
-
81
-
82
-
83
-
84
-
85
-
86
-
87
-
88
-
89
-
90
-
91
-
92
-
93
-
94
-
95
-
96
-
97
-
98
-
99
-
100
-
101
-
102
-
103
-
104
-
105
-
106
-
107
-
108
-
109
-
110
-
111
-
112
-
113
-
114
-
115
-
116
-
117
-
118
-
119
-
120
-
121
-
122
-
123
-
124
-
125
-
126
-
127
-
128
-
129
-
130
-
131
-
132
-
133
-
134
-
135
-
136
-
137
-
138
-
139
-
140
-
141
-
142
-
143
-
144
-
145
-
146
-
147
-
148
-
149
-
150
-
151
-
152
-
153
-
154
-
155
-
156
-
157
-
158
-
159
-
160
-
161
-
162
-
163
-
164
-
165
-
166
-
167
-
168
-
169
-
170
-
171
-
172
-
173
-
174
-
175
-
176
-
177
-
178
-
179
-
180
-
181
-
182
-
183
-
184
-
185
-
186
-
187
-
188
-
189
-
190
-
191
-
192
-
193
-
194
-
195
-
196
-
197
-
198
-
 199
199 -
 200
200 -
 201
201 -
 202
202 -
 203
203 -
 204
204 -
 205
205 -
 206
206 -
 207
207 -
 208
208 -
 209
209 -
 210
210 -
 211
211 -
 212
212 -
 213
213 -
 214
214 -
 215
215 -
 216
216 -
 217
217 -
 218
218 -
 219
219 -
220
-
221
-
222
-
223
-
224
 |
 |

207
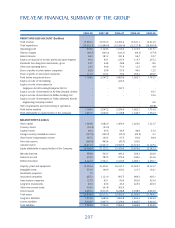
FIVE-YEAR FINANCIAL SUMMARY OF THE GROUP
2008-09 2007-08 2006-07 2005-06 2004-05
PROFIT AND LOSS ACCOUNT ($ million)
Total revenue 15,996.3 15,972.5 14,494.4 13,341.1 12,012.9
Total expenditure (15,092.7) (13,848.0) (13,180.0) (12,127.8) (10,695.8)
Operating profi t 903.6 2,124.5 1,314.4 1,213.3 1,317.1
Finance charges (89.7) (100.2) (124.1) (96.3) (77.5)
Interest income 96.0 181.2 181.8 96.7 52.7
Surplus on disposal of aircraft, spares and spare engines 60.6 49.1 237.9 115.7 215.2
Dividends from long-term investments, gross 23.7 34.8 38.8 24.6 8.0
Other non-operating items 29.4 96.8 77.9 12.3 9.8
Share of profi ts of joint venture companies 63.9 50.8 57.9 40.6 12.5
Share of profi ts of associated companies 111.1 110.2 79.0 255.2 203.7
Profi t before exceptional items 1,198.6 2,547.2 1,863.6 1,662.1 1,741.5
Surplus on sale of SIA Building - - 223.3 - -
Surplus on sale of investment in
Singapore Aircraft Leasing Enterprise Pte Ltd - - 197.7 - -
Surplus on sale of investment in Air New Zealand Limited - - - - 45.7
Surplus on sale of investment in Raffl es Holdings Ltd - - - - 32.6
Surplus on sale of investment in Taikoo (Xiamen) Aircraft
Engineering Company Limited - - - - 9.0
Staff compensation and restructuring of operations - - - - (37.8)
Profi t before taxation 1,198.6 2,547.2 2,284.6 1,662.1 1,791.0
Profi t attributable to equity holders of the Company 1,061.5 2,049.4 2,128.8 1,240.7 1,352.4
BALANCE SHEET ($ million)
Share capital 1,684.8 1,682.0 1,494.9 1,202.6 1,121.7
Treasury shares (44.4) (33.2) - - -
Capital reserve 86.3 95.6 44.9 40.8 41.9
Foreign currency translation reserve (137.9) (130.7) (59.5) (30.5) 3.1
Share-based compensation reserve 187.3 136.4 97.3 81.8 48.4
Fair value reserve (660.8) 443.4 (45.5) 163.6 -
General reserve 12,815.3 12,931.7 13,567.9 12,012.3 11,127.2
Equity attributable to equity holders of the Company 13,930.6 15,125.2 15,100.0 13,470.6 12,342.3
Minority interests 559.8 503.7 443.3 396.3 302.8
Deferred account 673.9 787.3 973.6 349.6 414.6
Deferred taxation 2,222.0 2,542.1 2,410.9 2,486.1 2,450.1
Property, plant and equipment 15,992.4 16,474.1 16,311.7 15,524.7 15,161.7
Intangible assets 553.0 106.6 100.2 121.7 144.1
Investment properties 7.0 - - - -
Associated companies 855.3 1,121.0 897.5 996.3 695.1
Joint venture companies 127.5 95.1 86.6 362.6 323.6
Long-term investments 43.2 43.3 43.3 425.9 476.3
Other non-current assets 403.6 361.8 303.9 - -
Current assets 6,836.5 8,313.3 8,248.8 5,938.3 4,943.9
Total assets 24,818.5 26,515.2 25,992.0 23,369.5 21,744.7
Long-term liabilities 1,513.5 1,689.4 1,805.8 1,824.4 2,333.3
Current liabilities 5,918.7 5,867.5 5,258.4 4,842.5 3,901.6
Total liabilities 7,432.2 7,556.9 7,064.2 6,666.9 6,234.9