Singapore Airlines 2009 Annual Report Download - page 179
Download and view the complete annual report
Please find page 179 of the 2009 Singapore Airlines annual report below. You can navigate through the pages in the report by either clicking on the pages listed below, or by using the keyword search tool below to find specific information within the annual report.-
 1
1 -
2
-
3
-
4
-
5
-
6
-
7
-
8
-
9
-
10
-
11
-
12
-
13
-
14
-
15
-
16
-
17
-
18
-
19
-
20
-
21
-
22
-
23
-
24
-
25
-
26
-
27
-
28
-
29
-
30
-
31
-
32
-
33
-
34
-
35
-
36
-
37
-
38
-
39
-
40
-
41
-
42
-
43
-
44
-
45
-
46
-
47
-
48
-
49
-
50
-
51
-
52
-
53
-
54
-
55
-
56
-
57
-
58
-
59
-
60
-
61
-
62
-
63
-
64
-
65
-
66
-
67
-
68
-
69
-
70
-
71
-
72
-
73
-
74
-
75
-
76
-
77
-
78
-
79
-
80
-
81
-
82
-
83
-
84
-
85
-
86
-
87
-
88
-
89
-
90
-
91
-
92
-
93
-
94
-
95
-
96
-
97
-
98
-
99
-
100
-
101
-
102
-
103
-
104
-
105
-
106
-
107
-
108
-
109
-
110
-
111
-
112
-
113
-
114
-
115
-
116
-
117
-
118
-
119
-
120
-
121
-
122
-
123
-
124
-
125
-
126
-
127
-
128
-
129
-
130
-
131
-
132
-
133
-
134
-
135
-
136
-
137
-
138
-
139
-
140
-
141
-
142
-
143
-
144
-
145
-
146
-
147
-
148
-
149
-
150
-
151
-
152
-
153
-
154
-
155
-
156
-
157
-
158
-
159
-
160
-
161
-
162
-
163
-
164
-
165
-
166
-
167
-
168
-
 169
169 -
 170
170 -
 171
171 -
 172
172 -
 173
173 -
 174
174 -
 175
175 -
 176
176 -
 177
177 -
 178
178 -
 179
179 -
 180
180 -
 181
181 -
 182
182 -
 183
183 -
 184
184 -
 185
185 -
 186
186 -
 187
187 -
 188
188 -
 189
189 -
190
-
191
-
192
-
193
-
194
-
195
-
196
-
197
-
198
-
199
-
200
-
201
-
202
-
203
-
204
-
205
-
206
-
207
-
208
-
209
-
210
-
211
-
212
-
213
-
214
-
215
-
216
-
217
-
218
-
219
-
220
-
221
-
222
-
223
-
224
 |
 |

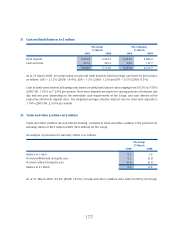
177
31 Cash and Bank Balances (in $ million)
The Group The Company
31 March 31 March
2009 2008 2009 2008
Fixed deposits 3,540.8 4,723.7 3,432.0 4,089.0
Cash and bank 307.2 395.3 26.0 127.7
3,848.0 5,119.0 3,458.0 4,216.7
As at 31 March 2009, the composition of cash and bank balances held in foreign currencies by the Group is
as follows: USD – 21.2% (2008: 18.4%), EUR – 1.5% (2008: 1.2%) and JPY – 0.5% (2008: 0.3%).
Cash at bank earns interest at fl oating rates based on daily bank deposit rates ranging from 0.02% to 7.50%
(2007-08: 1.03% to 7.23%) per annum. Short-term deposits are made for varying periods of between one
day and one year depending on the immediate cash requirements of the Group, and earn interest at the
respective short-term deposit rates. The weighted average effective interest rate for short-term deposits is
1.14% (2007-08: 2.95%) per annum.
32 Trade and Other Creditors (in $ million)
Trade and other creditors are non-interest bearing. Included in trade and other creditors is the provision for
warranty claims of $0.5 million (2008: $0.6 million) for the Group.
An analysis of provision for warranty claims is as follows:
The Group
31 March
2009 2008
Balance at 1 April 0.6 1.6
Provision/(Writeback) during the year 0.2 (0.3)
Provision utilised during the year (0.3) (0.7)
Balance at 31 March 0.5 0.6
As at 31 March 2009, 33.9% (2008: 18.9%) of trade and other creditors were held in USD by the Group.