Singapore Airlines 2009 Annual Report Download - page 67
Download and view the complete annual report
Please find page 67 of the 2009 Singapore Airlines annual report below. You can navigate through the pages in the report by either clicking on the pages listed below, or by using the keyword search tool below to find specific information within the annual report.-
 1
1 -
2
-
3
-
4
-
5
-
6
-
7
-
8
-
9
-
10
-
11
-
12
-
13
-
14
-
15
-
16
-
17
-
18
-
19
-
20
-
21
-
22
-
23
-
24
-
25
-
26
-
27
-
28
-
29
-
30
-
31
-
32
-
33
-
34
-
35
-
36
-
37
-
38
-
39
-
40
-
41
-
42
-
43
-
44
-
45
-
46
-
47
-
48
-
49
-
50
-
51
-
52
-
53
-
54
-
55
-
56
-
 57
57 -
 58
58 -
 59
59 -
 60
60 -
 61
61 -
 62
62 -
 63
63 -
 64
64 -
 65
65 -
 66
66 -
 67
67 -
 68
68 -
 69
69 -
 70
70 -
 71
71 -
 72
72 -
 73
73 -
 74
74 -
 75
75 -
 76
76 -
 77
77 -
78
-
79
-
80
-
81
-
82
-
83
-
84
-
85
-
86
-
87
-
88
-
89
-
90
-
91
-
92
-
93
-
94
-
95
-
96
-
97
-
98
-
99
-
100
-
101
-
102
-
103
-
104
-
105
-
106
-
107
-
108
-
109
-
110
-
111
-
112
-
113
-
114
-
115
-
116
-
117
-
118
-
119
-
120
-
121
-
122
-
123
-
124
-
125
-
126
-
127
-
128
-
129
-
130
-
131
-
132
-
133
-
134
-
135
-
136
-
137
-
138
-
139
-
140
-
141
-
142
-
143
-
144
-
145
-
146
-
147
-
148
-
149
-
150
-
151
-
152
-
153
-
154
-
155
-
156
-
157
-
158
-
159
-
160
-
161
-
162
-
163
-
164
-
165
-
166
-
167
-
168
-
169
-
170
-
171
-
172
-
173
-
174
-
175
-
176
-
177
-
178
-
179
-
180
-
181
-
182
-
183
-
184
-
185
-
186
-
187
-
188
-
189
-
190
-
191
-
192
-
193
-
194
-
195
-
196
-
197
-
198
-
199
-
200
-
201
-
202
-
203
-
204
-
205
-
206
-
207
-
208
-
209
-
210
-
211
-
212
-
213
-
214
-
215
-
216
-
217
-
218
-
219
-
220
-
221
-
222
-
223
-
224
 |
 |

65
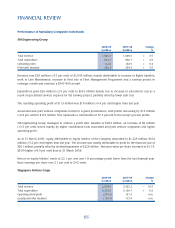
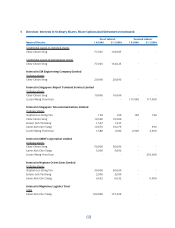
Performance of Subsidiary Companies
The major subsidiary companies are Singapore Airport Terminal Services Limited (“SATS”), SIA Engineering
Company Limited (“SIAEC”), Singapore Airlines Cargo Pte Ltd (“SIA Cargo”) and SilkAir (Singapore) Private Limited
(“SilkAir”). The following performance review includes intra-group transactions.
Singapore Airport Terminal Services Group
2008-09 2007-08 Change
$ million $ million %
Total revenue 1,062.1 958.0 + 10.9
Total expenditure 891.2 783.7 + 13.7
Operating profi t 170.9 174.3 – 2.0
Profi t after taxation 148.4 195.2 – 24.0
SATS Group’s revenue increased by $104 million to $1,062 million, mainly on account of revenue contribution
from Singapore Food Industries, which was acquired in February 2009. SATS Group also started to consolidate
results of Country Food Macau and SATS Hong Kong from 3rd quarter of the fi nancial year.
Operating expenditure increased $108 million (+13.7 per cent) to $891 million primarily from consolidation of
the new subsidiary companies. This fi nancial year also saw the full impact of additional cost from dual terminal
operations with the commencement of Terminal 3 operations at Changi Airport. This was partially offset by Jobs
Credit from the Singapore Government introduced in response to the weakening operating environment.
As a consequence, SATS Group’s operating profi t declined $3 million (-2.0 per cent) to $171 million.
Profi t contribution from overseas associated companies fell 50.3 per cent to $22 million for the fi nancial year
ended 31 March 2009, mainly due to weaker aviation industry.
Profi t after taxation decreased $47 million (-24.0 per cent) to $148 million, due to lower operating profi t, lower
contribution from overseas associated companies and loss on disposal of short-term non-equity investments.
In addition, last year’s results included a one-off exceptional gain on the sale of Express Courier Centre 2 of
$17 million.
As at 31 March 2009, equity holders’ funds of the SATS Group were $1,398 million (+1.0 per cent). Net asset
value per share of the Group as at 31 March 2009 remained at $1.29.
Return on equity holders’ funds at 10.5 per cent, was 3.9 percentage points lower than the last fi nancial year.
Basic earnings per share decreased 4.6 cents (-25.3 per cent) to 13.6 cents.