Singapore Airlines 2009 Annual Report Download - page 176
Download and view the complete annual report
Please find page 176 of the 2009 Singapore Airlines annual report below. You can navigate through the pages in the report by either clicking on the pages listed below, or by using the keyword search tool below to find specific information within the annual report.-
 1
1 -
2
-
3
-
4
-
5
-
6
-
7
-
8
-
9
-
10
-
11
-
12
-
13
-
14
-
15
-
16
-
17
-
18
-
19
-
20
-
21
-
22
-
23
-
24
-
25
-
26
-
27
-
28
-
29
-
30
-
31
-
32
-
33
-
34
-
35
-
36
-
37
-
38
-
39
-
40
-
41
-
42
-
43
-
44
-
45
-
46
-
47
-
48
-
49
-
50
-
51
-
52
-
53
-
54
-
55
-
56
-
57
-
58
-
59
-
60
-
61
-
62
-
63
-
64
-
65
-
66
-
67
-
68
-
69
-
70
-
71
-
72
-
73
-
74
-
75
-
76
-
77
-
78
-
79
-
80
-
81
-
82
-
83
-
84
-
85
-
86
-
87
-
88
-
89
-
90
-
91
-
92
-
93
-
94
-
95
-
96
-
97
-
98
-
99
-
100
-
101
-
102
-
103
-
104
-
105
-
106
-
107
-
108
-
109
-
110
-
111
-
112
-
113
-
114
-
115
-
116
-
117
-
118
-
119
-
120
-
121
-
122
-
123
-
124
-
125
-
126
-
127
-
128
-
129
-
130
-
131
-
132
-
133
-
134
-
135
-
136
-
137
-
138
-
139
-
140
-
141
-
142
-
143
-
144
-
145
-
146
-
147
-
148
-
149
-
150
-
151
-
152
-
153
-
154
-
155
-
156
-
157
-
158
-
159
-
160
-
161
-
162
-
163
-
164
-
165
-
 166
166 -
 167
167 -
 168
168 -
 169
169 -
 170
170 -
 171
171 -
 172
172 -
 173
173 -
 174
174 -
 175
175 -
 176
176 -
 177
177 -
 178
178 -
 179
179 -
 180
180 -
 181
181 -
 182
182 -
 183
183 -
 184
184 -
 185
185 -
 186
186 -
187
-
188
-
189
-
190
-
191
-
192
-
193
-
194
-
195
-
196
-
197
-
198
-
199
-
200
-
201
-
202
-
203
-
204
-
205
-
206
-
207
-
208
-
209
-
210
-
211
-
212
-
213
-
214
-
215
-
216
-
217
-
218
-
219
-
220
-
221
-
222
-
223
-
224
 |
 |

174
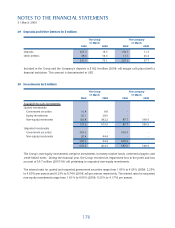
27 Inventories (in $ million)
The Group The Company
31 March 31 March
2009 2008 2009 2008
Technical stocks and stores 383.4 440.1 321.4 391.8
Catering and general stocks 70.8 24.6 17.3 14.5
Work-in-progress 49.0 43.0 - -
Total inventories at lower of cost and net
realisable value 503.2 507.7 338.7 406.3
During the fi nancial year, the Group wrote down $22.7 million (2007-08: $22.0 million) of inventories
which are recognised as other operating expenses in the profi t and loss account.
28 Trade Debtors (in $ million)
The table below is an analysis of trade debtors as at 31 March:
The Group The Company
31 March 31 March
2009 2008 2009 2008
Not past due and not impaired 1,330.5 1,835.0 961.2 1,363.7
Past due but not impaired 149.2 198.2 31.7 65.9
1,479.7 2,033.2 992.9 1,429.6
Impaired trade debtors - collectively assessed 26.7 18.2 4.0 3.7
Less: Accumulated impairment losses (21.3) (10.2) (3.0) (2.2)
5.4 8.0 1.0 1.5
Impaired trade debtors - individually assessed
Customers in bankruptcy or other
fi nancial reorganisation 9.5 5.0 5.7 0.3
Customers who default in payment within
stipulated framework of IATA Clearing
House or Bank Settlement Plan 5.4 4.5 3.9 4.2
Less: Accumulated impairment losses (14.5) (6.9) (8.6) (2.2)
0.4 2.6 1.0 2.3
Total trade debtors, net 1,485.5 2,043.8 994.9 1,433.4
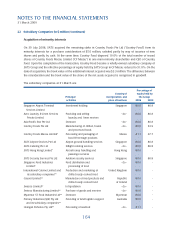
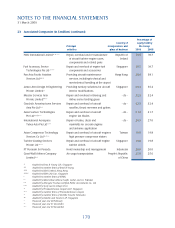
NOTES TO THE FINANCIAL STATEMENTS
31 March 2009