Singapore Airlines 2009 Annual Report Download - page 64
Download and view the complete annual report
Please find page 64 of the 2009 Singapore Airlines annual report below. You can navigate through the pages in the report by either clicking on the pages listed below, or by using the keyword search tool below to find specific information within the annual report.-
 1
1 -
2
-
3
-
4
-
5
-
6
-
7
-
8
-
9
-
10
-
11
-
12
-
13
-
14
-
15
-
16
-
17
-
18
-
19
-
20
-
21
-
22
-
23
-
24
-
25
-
26
-
27
-
28
-
29
-
30
-
31
-
32
-
33
-
34
-
35
-
36
-
37
-
38
-
39
-
40
-
41
-
42
-
43
-
44
-
45
-
46
-
47
-
48
-
49
-
50
-
51
-
52
-
53
-
 54
54 -
 55
55 -
 56
56 -
 57
57 -
 58
58 -
 59
59 -
 60
60 -
 61
61 -
 62
62 -
 63
63 -
 64
64 -
 65
65 -
 66
66 -
 67
67 -
 68
68 -
 69
69 -
 70
70 -
 71
71 -
 72
72 -
 73
73 -
 74
74 -
75
-
76
-
77
-
78
-
79
-
80
-
81
-
82
-
83
-
84
-
85
-
86
-
87
-
88
-
89
-
90
-
91
-
92
-
93
-
94
-
95
-
96
-
97
-
98
-
99
-
100
-
101
-
102
-
103
-
104
-
105
-
106
-
107
-
108
-
109
-
110
-
111
-
112
-
113
-
114
-
115
-
116
-
117
-
118
-
119
-
120
-
121
-
122
-
123
-
124
-
125
-
126
-
127
-
128
-
129
-
130
-
131
-
132
-
133
-
134
-
135
-
136
-
137
-
138
-
139
-
140
-
141
-
142
-
143
-
144
-
145
-
146
-
147
-
148
-
149
-
150
-
151
-
152
-
153
-
154
-
155
-
156
-
157
-
158
-
159
-
160
-
161
-
162
-
163
-
164
-
165
-
166
-
167
-
168
-
169
-
170
-
171
-
172
-
173
-
174
-
175
-
176
-
177
-
178
-
179
-
180
-
181
-
182
-
183
-
184
-
185
-
186
-
187
-
188
-
189
-
190
-
191
-
192
-
193
-
194
-
195
-
196
-
197
-
198
-
199
-
200
-
201
-
202
-
203
-
204
-
205
-
206
-
207
-
208
-
209
-
210
-
211
-
212
-
213
-
214
-
215
-
216
-
217
-
218
-
219
-
220
-
221
-
222
-
223
-
224
 |
 |
62
Performance of the Company (continued)
Expenditure (continued)
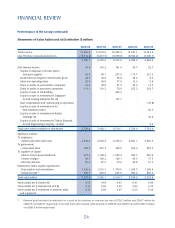
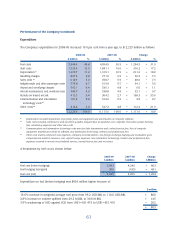
Staff costs declined by $316 million mainly due to lower provision for profi t-sharing bonus due to weaker
operating performance.
Depreciation charges increased $212 million mainly due to (i) capitalisation of expenditure for heavy maintenance
visits on aircraft and engine overhauls, and (ii) progressive delivery of B777-300ER aircraft (commissioning of
fi ve B777-300ER aircraft during the year) and one A380 aircraft. The increase was partially offset by sale and
leaseback of fi ve B777 aircraft during the year.
Handling charges was $56 million higher, attributable to new A380 aircraft joining the fl eet, increase in number
of handlings and higher airport charges imposed by authorities in China.
Sales costs was $48 million lower than last year, due mainly to lower commissions and incentives, and computer
reservation system booking fees.
Aircraft maintenance and overhaul costs decreased $52 million with lesser airframe activities for B747-400 fl eet and
‘C’ checks for B777 aircraft fl eet.
Rentals on leased aircraft increased $108 million primarily attributable to lease of fi ve A380 aircraft and sale and
leaseback of fi ve B777 aircraft during the year, partially offset by the return of fi ve B747-400 aircraft on expiry
of lease.
Other costs decreased by $112 million, largely due to foreign exchange revaluation and hedging gain this year
(against loss last year).
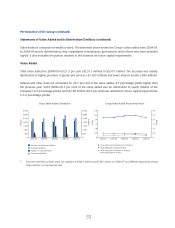
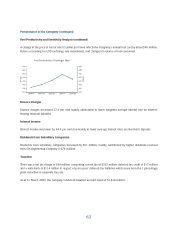
Fuel Productivity and Sensitivity Analysis
Fuel productivity as measured by load tonne-km per barrel (ltk/BBL) decreased by 2.9% over the previous year to
416 ltk/BBL. This was attributable to lower loads, partially mitigated by the addition of new A380-800 and B777-
300ER aircraft.
A change in fuel productivity (passenger aircraft) of 1.0 per cent would impact the Company’s annual fuel cost by
about $54 million, before accounting for changes in fuel price, USD exchange rate and fl ying operations.
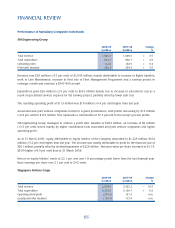
FINANCIAL REVIEW