Singapore Airlines 2009 Annual Report Download - page 69
Download and view the complete annual report
Please find page 69 of the 2009 Singapore Airlines annual report below. You can navigate through the pages in the report by either clicking on the pages listed below, or by using the keyword search tool below to find specific information within the annual report.-
 1
1 -
2
-
3
-
4
-
5
-
6
-
7
-
8
-
9
-
10
-
11
-
12
-
13
-
14
-
15
-
16
-
17
-
18
-
19
-
20
-
21
-
22
-
23
-
24
-
25
-
26
-
27
-
28
-
29
-
30
-
31
-
32
-
33
-
34
-
35
-
36
-
37
-
38
-
39
-
40
-
41
-
42
-
43
-
44
-
45
-
46
-
47
-
48
-
49
-
50
-
51
-
52
-
53
-
54
-
55
-
56
-
57
-
58
-
 59
59 -
 60
60 -
 61
61 -
 62
62 -
 63
63 -
 64
64 -
 65
65 -
 66
66 -
 67
67 -
 68
68 -
 69
69 -
 70
70 -
 71
71 -
 72
72 -
 73
73 -
 74
74 -
 75
75 -
 76
76 -
 77
77 -
 78
78 -
 79
79 -
80
-
81
-
82
-
83
-
84
-
85
-
86
-
87
-
88
-
89
-
90
-
91
-
92
-
93
-
94
-
95
-
96
-
97
-
98
-
99
-
100
-
101
-
102
-
103
-
104
-
105
-
106
-
107
-
108
-
109
-
110
-
111
-
112
-
113
-
114
-
115
-
116
-
117
-
118
-
119
-
120
-
121
-
122
-
123
-
124
-
125
-
126
-
127
-
128
-
129
-
130
-
131
-
132
-
133
-
134
-
135
-
136
-
137
-
138
-
139
-
140
-
141
-
142
-
143
-
144
-
145
-
146
-
147
-
148
-
149
-
150
-
151
-
152
-
153
-
154
-
155
-
156
-
157
-
158
-
159
-
160
-
161
-
162
-
163
-
164
-
165
-
166
-
167
-
168
-
169
-
170
-
171
-
172
-
173
-
174
-
175
-
176
-
177
-
178
-
179
-
180
-
181
-
182
-
183
-
184
-
185
-
186
-
187
-
188
-
189
-
190
-
191
-
192
-
193
-
194
-
195
-
196
-
197
-
198
-
199
-
200
-
201
-
202
-
203
-
204
-
205
-
206
-
207
-
208
-
209
-
210
-
211
-
212
-
213
-
214
-
215
-
216
-
217
-
218
-
219
-
220
-
221
-
222
-
223
-
224
 |
 |

67
Performance of Subsidiary Companies (continued)
Singapore Airlines Cargo (continued)
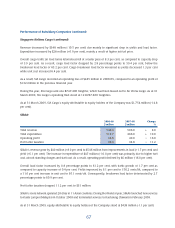
Revenue decreased by $348 million (-10.5 per cent) due mainly to signifi cant drop in yields and load factor.
Expenditure increased by $28 million (+0.9 per cent), mainly a result of higher jet fuel price.
Overall cargo traffi c (in load tonne kilometres) fell at a faster pace of 8.3 per cent, as compared to capacity drop
of 3.9 per cent. As a result, cargo load factor dropped by 2.8 percentage points to 59.4 per cent, below the
breakeven load factor of 65.2 per cent. Cargo breakeven load factor worsened as yields decreased 1.3 per cent
while unit cost increased 6.4 per cent.
As a result, SIA Cargo recorded an operating loss of $245 million in 2008-09, compared to an operating profi t of
$132 million in the previous fi nancial year.
During the year, SIA Cargo sold one B747-400 freighter, which had been leased out to Air China Cargo. As at 31
March 2009, SIA Cargo’s operating fl eet stood at 12 B747-400 freighters.
As at 31 March 2009, SIA Cargo’s equity attributable to equity holders of the Company was $1,754 million (-14.8
per cent).
SilkAir
2008-09 2007-08 Change
$ million $ million %
Total revenue 546.3 506.0 + 8.0
Total expenditure 512.7 466.0 + 10.0
Operating profi t 33.6 40.0 – 16.0
Profi t after taxation 30.9 34.8 – 11.2
SilkAir’s revenue grew by $40 million (+8.0 per cent) to $546 million from improvements in load (+1.7 per cent) and
yield (+6.1 per cent). The increase in expenditure of $47 million (+10.0 per cent) was primarily due to higher fuel
cost, aircraft standing charges and staff cost. As a result, operating profi t declined by $6 million (-16.0 per cent).
Overall load factor increased by 0.8 percentage points to 61.2 per cent, with traffi c growth of 1.7 per cent as
compared to capacity increase of 0.4 per cent. Yields improved by 6.1 per cent to 156.2 cents/ltk, compared to
a 11.0 per cent increase in unit cost to 95.1 cents/ctk. Consequently, breakeven load factor deteriorated by 2.7
percentage points to 60.9 per cent.
Profi t after taxation dropped 11.2 per cent to $31 million.
SilkAir’s route network spanned 28 cities in 11 Asian countries. During the fi nancial year, SilkAir launched new services
to Kuala Lumpur (Malaysia) in October 2008 and terminated services to Kaohsiung (Taiwan) in February 2009.
As at 31 March 2009, equity attributable to equity holders of the Company stood at $438 million (-1.1 per cent).