Singapore Airlines 2009 Annual Report Download - page 211
Download and view the complete annual report
Please find page 211 of the 2009 Singapore Airlines annual report below. You can navigate through the pages in the report by either clicking on the pages listed below, or by using the keyword search tool below to find specific information within the annual report.-
 1
1 -
2
-
3
-
4
-
5
-
6
-
7
-
8
-
9
-
10
-
11
-
12
-
13
-
14
-
15
-
16
-
17
-
18
-
19
-
20
-
21
-
22
-
23
-
24
-
25
-
26
-
27
-
28
-
29
-
30
-
31
-
32
-
33
-
34
-
35
-
36
-
37
-
38
-
39
-
40
-
41
-
42
-
43
-
44
-
45
-
46
-
47
-
48
-
49
-
50
-
51
-
52
-
53
-
54
-
55
-
56
-
57
-
58
-
59
-
60
-
61
-
62
-
63
-
64
-
65
-
66
-
67
-
68
-
69
-
70
-
71
-
72
-
73
-
74
-
75
-
76
-
77
-
78
-
79
-
80
-
81
-
82
-
83
-
84
-
85
-
86
-
87
-
88
-
89
-
90
-
91
-
92
-
93
-
94
-
95
-
96
-
97
-
98
-
99
-
100
-
101
-
102
-
103
-
104
-
105
-
106
-
107
-
108
-
109
-
110
-
111
-
112
-
113
-
114
-
115
-
116
-
117
-
118
-
119
-
120
-
121
-
122
-
123
-
124
-
125
-
126
-
127
-
128
-
129
-
130
-
131
-
132
-
133
-
134
-
135
-
136
-
137
-
138
-
139
-
140
-
141
-
142
-
143
-
144
-
145
-
146
-
147
-
148
-
149
-
150
-
151
-
152
-
153
-
154
-
155
-
156
-
157
-
158
-
159
-
160
-
161
-
162
-
163
-
164
-
165
-
166
-
167
-
168
-
169
-
170
-
171
-
172
-
173
-
174
-
175
-
176
-
177
-
178
-
179
-
180
-
181
-
182
-
183
-
184
-
185
-
186
-
187
-
188
-
189
-
190
-
191
-
192
-
193
-
194
-
195
-
196
-
197
-
198
-
199
-
200
-
 201
201 -
 202
202 -
 203
203 -
 204
204 -
 205
205 -
 206
206 -
 207
207 -
 208
208 -
 209
209 -
 210
210 -
 211
211 -
 212
212 -
 213
213 -
 214
214 -
 215
215 -
 216
216 -
 217
217 -
 218
218 -
 219
219 -
 220
220 -
 221
221 -
222
-
223
-
224
 |
 |

209
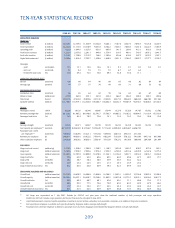
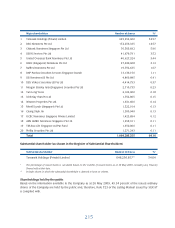
TEN-YEAR STATISTICAL RECORD
2008-09 2007-08 2006-07 2005-06 2004-05 2003-04 2002-03 2001-02 2000-01 1999-00
SINGAPORE AIRLINES
FINANCIAL R1
Total revenue ($ million) 13,049.5 12,759.6 11,343.9 10,302.8 9,260.1 7,187.6 8,047.0 7,694.7 9,125.8 8,200.7
Total expenditure ($ million) 12,226.6 11,115.6 10,316.9 9,651.8 8,562.2 7,046.1 7,838.0 7,281.6 8,222.5 7,485.9
Operating profi t ($ million) 822.9 1,644.0 1,027.0 651.0 697.9 141.5 209.0 413.1 903.3 714.8
Profi t before taxation ($ million) 1,252.4 2,077.6 2,291.1 940.8 1,570.4 319.7 460.1 740.7 1,607.2 1,641.5
Profi t after taxation ($ million) 1,218.7 1,758.8 2,213.2 746.0 1,283.6 420.6 618.0 567.2 1,422.2 1,267.1
Capital disbursements R2 ($ million) 1,698.6 1,814.4 2,792.7 1,458.6 1,608.9 2,051.3 2,766.2 2,885.7 2,777.7 3,303.7
Passenger
- yield (cents/pkm) 12.5 12.1 10.9 10.6 10.1 9.2 9.1 9.0 9.4 9.1
- unit cost (cents/ask) 9.2 8.4 7.9 7.5 7.0 6.7 6.7 6.4 - -
- breakeven load factor (%) 73.6 69.4 72.5 70.8 69.3 72.8 73.6 71.1 - -
OPERATING PASSENGER FLEET
Aircraft (numbers) 103 98 94 90 89 85 96 92 84 84
Average age (months) 74 77 75 76 64 60 71 69 70 62
PASSENGER PRODUCTION
Destination cities (numbers) 66 65 64 62 59 56 60 64 67 69
Distance fl own (million km) 379.8 365.9 353.1 341.8 325.4 266.7 296.2 288.4 289.1 280.6
Time fl own (hours) 492,103 474,432 458,936 441,510 419,925 342,715 384,652 368,204 366,784 351,560
Available seat-km (million) 117,788.7 113,919.1 112,543.8 109,483.7 104,662.3 88,252.7 99,565.9 94,558.5 92,648.0 87,728.3
TRAFFIC
Passengers carried (‘000) 18,293 19,120 18,346 16,995 15,944 13,278 15,326 14,765 15,002 13,782
Revenue passenger-km (million) 90,128.1 91,485.2 89,148.8 82,741.7 77,593.7 64,685.2 74,183.2 69,994.5 71,118.4 65,718.4
Passenger load factor (%) 76.5 80.3 79.2 75.6 74.1 73.3 74.5 74.0 76.8 74.9
STAFF
Average strength (numbers) 14,343 14,071 13,847 13,729 13,572 14,010 14,418 14,205 14,254 13,720
Seat capacity per employee R3 (seat-km) 8,212,278 8,096,020 8,127,667 7,974,630 7,711,634 6,299,265 6,905,667 6,656,705 - -
Passenger load carried
per employee R4 (tonne-km) 598,047 618,295 613,211 577,784 549,904 448,513 495,617 471,300 - -
Revenue per employee ($) 909,817 906,801 819,232 750,441 682,294 513,034 558,122 541,690 647,516 607,966
Value added per employee ($) 294,666 368,382 368,831 258,810 301,024 179,272 191,566 189,806 284,369 291,494
SIA CARGO
Cargo and mail carried (million kg) 1,219.5 1,308.0 1,284.9 1,248.5 1,149.5 1,050.9 1,043.2 938.5 975.4 905.1
Cargo load (million tonne-km) 7,299.3 7,959.2 7,995.6 7,874.4 7,333.2 6,749.4 6,913.6 6,039.8 6,167.6 5,775.4
Gross capacity (million tonne-km) 12,292.5 12,787.8 12,889.8 12,378.9 11,544.1 10,156.5 9,927.1 8,950.3 8,876.1 8,244.4
Cargo load factor (%) 59.4 62.2 62.0 63.6 63.5 66.5 69.6 67.5 69.5 70.1
Cargo yield (cents/ltk) 38.2 38.7 38.4 38.6 35.9 36.7 34.2 32.2 - -
Cargo unit cost (cents/ctk) 24.9 23.4 24.5 23.5 21.3 23.0 23.9 23.2 - -
Cargo breakeven load factor (%) 65.2 60.5 63.8 60.9 59.3 62.7 69.9 72.0 - -
SINGAPORE AIRLINES AND SIA CARGO
Overall load (million tonne-km) 15,876.9 16,659.2 16,486.8 15,806.8 14,796.5 13,033.1 14,059.5 12,734.6 12,985.3 12,038.4
Overall capacity (million tonne-km) 23,946.0 24,052.1 24,009.7 23,208.0 21,882.5 18,873.8 19,773.7 18,305.1 18,034.0 16,917.2
Overall load factor (%) 66.3 69.3 68.7 68.1 67.6 69.1 71.1 69.6 72.0 71.2
Overall yield (cents/ltk) 88.6 85.0 77.5 74.6 70.8 65.0 64.5 64.9 67.9 66.0
Overall unit cost (cents/ctk) 57.7 52.3 50.0 47.7 44.5 43.4 45.5 44.9 45.4 43.7
Overall breakeven load factor (%) 65.1 61.5 64.5 63.9 62.9 66.8 70.5 69.2 66.9 66.2
R1 SIA Cargo was corporatised on 1 July 2001. Statistics for 2000-01 and prior years show the combined numbers of both passenger and cargo operations.
Statistics for 2001-02 includes cargo operations for the fi rst three months only (April to June 2001).
R2 Capital disbursements comprised capital expenditure, investments in joint venture, subsidiary and associated companies, and additional long-term investments.
R3 Seat capacity per employee is available seat capacity divided by Singapore Airlines average staff strength.
R4 Passenger load carried per employee is defi ned as passenger load and excess baggage carried divided by Singapore Airlines average staff strength.