Singapore Airlines 2009 Annual Report Download - page 59
Download and view the complete annual report
Please find page 59 of the 2009 Singapore Airlines annual report below. You can navigate through the pages in the report by either clicking on the pages listed below, or by using the keyword search tool below to find specific information within the annual report.-
 1
1 -
2
-
3
-
4
-
5
-
6
-
7
-
8
-
9
-
10
-
11
-
12
-
13
-
14
-
15
-
16
-
17
-
18
-
19
-
20
-
21
-
22
-
23
-
24
-
25
-
26
-
27
-
28
-
29
-
30
-
31
-
32
-
33
-
34
-
35
-
36
-
37
-
38
-
39
-
40
-
41
-
42
-
43
-
44
-
45
-
46
-
47
-
48
-
 49
49 -
 50
50 -
 51
51 -
 52
52 -
 53
53 -
 54
54 -
 55
55 -
 56
56 -
 57
57 -
 58
58 -
 59
59 -
 60
60 -
 61
61 -
 62
62 -
 63
63 -
 64
64 -
 65
65 -
 66
66 -
 67
67 -
 68
68 -
 69
69 -
70
-
71
-
72
-
73
-
74
-
75
-
76
-
77
-
78
-
79
-
80
-
81
-
82
-
83
-
84
-
85
-
86
-
87
-
88
-
89
-
90
-
91
-
92
-
93
-
94
-
95
-
96
-
97
-
98
-
99
-
100
-
101
-
102
-
103
-
104
-
105
-
106
-
107
-
108
-
109
-
110
-
111
-
112
-
113
-
114
-
115
-
116
-
117
-
118
-
119
-
120
-
121
-
122
-
123
-
124
-
125
-
126
-
127
-
128
-
129
-
130
-
131
-
132
-
133
-
134
-
135
-
136
-
137
-
138
-
139
-
140
-
141
-
142
-
143
-
144
-
145
-
146
-
147
-
148
-
149
-
150
-
151
-
152
-
153
-
154
-
155
-
156
-
157
-
158
-
159
-
160
-
161
-
162
-
163
-
164
-
165
-
166
-
167
-
168
-
169
-
170
-
171
-
172
-
173
-
174
-
175
-
176
-
177
-
178
-
179
-
180
-
181
-
182
-
183
-
184
-
185
-
186
-
187
-
188
-
189
-
190
-
191
-
192
-
193
-
194
-
195
-
196
-
197
-
198
-
199
-
200
-
201
-
202
-
203
-
204
-
205
-
206
-
207
-
208
-
209
-
210
-
211
-
212
-
213
-
214
-
215
-
216
-
217
-
218
-
219
-
220
-
221
-
222
-
223
-
224
 |
 |

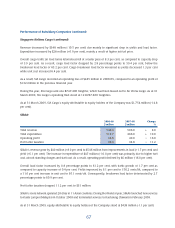
57
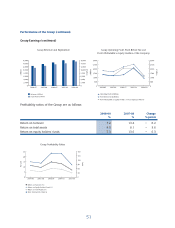
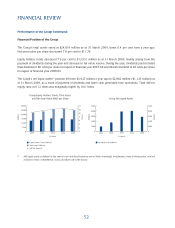
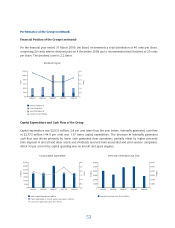
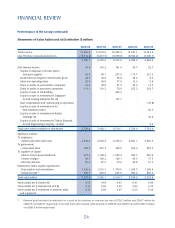
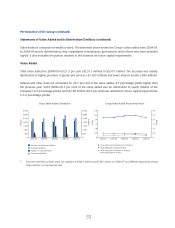
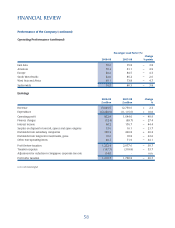
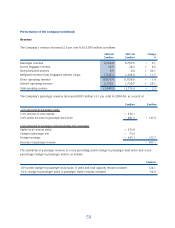
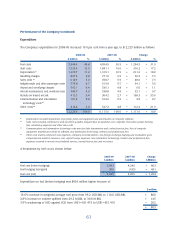
Performance of the Company (continued)
Operating Performance (continued)
The improvement in passenger yield was due mainly to higher local currency yields, partially offset by weaker
revenue generating currencies.
The spread between passenger load factor and breakeven load factor dropped 8.0 percentage points to 2.9
percentage points in 2008-09.
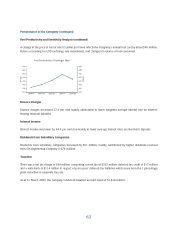
A review of the Company’s operating performance by route region is as follows:
By Route Region R1 (2008-09 against 2007-08)
Revenue Available
Passengers Carried Passenger KM Seat KM
Change (thousand) % Change % Change
East Asia – 896 – 9.9 – 5.2
Americas – 193 – 12.4 – 6.8
Europe + 224 + 11.2 + 17.3
South West Pacifi c + 107 + 3.6 + 6.8
West Asia and Africa – 69 + 1.0 + 7.8
Systemwide – 827 – 1.5 + 3.4
R1 Each route region comprises routes originating from Singapore to fi nal destinations in countries within the region concerned and vice
versa. For example, Singapore-Hong Kong-San Francisco-Hong Kong-Singapore route is classifi ed under Americas region. East Asia
covers Brunei, Hong Kong SAR, Indonesia, Japan, South Korea, Malaysia, People’s Republic of China, Philippines, Thailand, Taiwan
and Vietnam. Americas comprises Canada and USA. Europe consists of Denmark, France, Germany, Greece, Italy, United Kingdom,
Russia, Spain, Switzerland and The Netherlands. South West Pacifi c covers Australia and New Zealand. West Asia and Africa are made
up of Bangladesh, Egypt, India, Kuwait, Maldives, Pakistan, Saudi Arabia, South Africa, Sri Lanka, Turkey and United Arab Emirates.