Singapore Airlines 2009 Annual Report Download - page 60
Download and view the complete annual report
Please find page 60 of the 2009 Singapore Airlines annual report below. You can navigate through the pages in the report by either clicking on the pages listed below, or by using the keyword search tool below to find specific information within the annual report.-
 1
1 -
2
-
3
-
4
-
5
-
6
-
7
-
8
-
9
-
10
-
11
-
12
-
13
-
14
-
15
-
16
-
17
-
18
-
19
-
20
-
21
-
22
-
23
-
24
-
25
-
26
-
27
-
28
-
29
-
30
-
31
-
32
-
33
-
34
-
35
-
36
-
37
-
38
-
39
-
40
-
41
-
42
-
43
-
44
-
45
-
46
-
47
-
48
-
49
-
 50
50 -
 51
51 -
 52
52 -
 53
53 -
 54
54 -
 55
55 -
 56
56 -
 57
57 -
 58
58 -
 59
59 -
 60
60 -
 61
61 -
 62
62 -
 63
63 -
 64
64 -
 65
65 -
 66
66 -
 67
67 -
 68
68 -
 69
69 -
 70
70 -
71
-
72
-
73
-
74
-
75
-
76
-
77
-
78
-
79
-
80
-
81
-
82
-
83
-
84
-
85
-
86
-
87
-
88
-
89
-
90
-
91
-
92
-
93
-
94
-
95
-
96
-
97
-
98
-
99
-
100
-
101
-
102
-
103
-
104
-
105
-
106
-
107
-
108
-
109
-
110
-
111
-
112
-
113
-
114
-
115
-
116
-
117
-
118
-
119
-
120
-
121
-
122
-
123
-
124
-
125
-
126
-
127
-
128
-
129
-
130
-
131
-
132
-
133
-
134
-
135
-
136
-
137
-
138
-
139
-
140
-
141
-
142
-
143
-
144
-
145
-
146
-
147
-
148
-
149
-
150
-
151
-
152
-
153
-
154
-
155
-
156
-
157
-
158
-
159
-
160
-
161
-
162
-
163
-
164
-
165
-
166
-
167
-
168
-
169
-
170
-
171
-
172
-
173
-
174
-
175
-
176
-
177
-
178
-
179
-
180
-
181
-
182
-
183
-
184
-
185
-
186
-
187
-
188
-
189
-
190
-
191
-
192
-
193
-
194
-
195
-
196
-
197
-
198
-
199
-
200
-
201
-
202
-
203
-
204
-
205
-
206
-
207
-
208
-
209
-
210
-
211
-
212
-
213
-
214
-
215
-
216
-
217
-
218
-
219
-
220
-
221
-
222
-
223
-
224
 |
 |

58
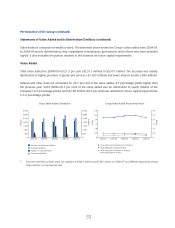
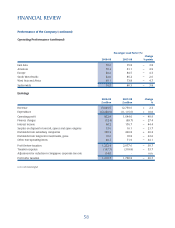
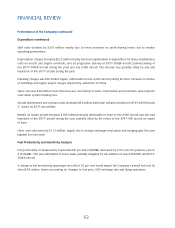
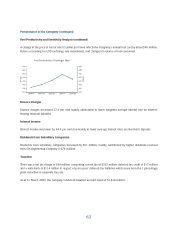
Performance of the Company (continued)
Operating Performance (continued)
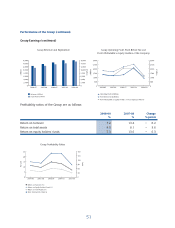
Passenger Load Factor (%)
Change
2008-09 2007-08 % points
East Asia 72.0 75.8 – 3.8
Americas 76.2 81.1 – 4.9
Europe 80.2 84.5 – 4.3
South West Pacifi c 82.6 85.2 – 2.6
West Asia and Africa 69.1 73.8 – 4.7
Systemwide 76.5 80.3 – 3.8
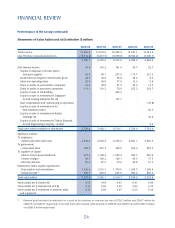
Earnings
2008-09 2007-08 Change
$ million $ million %
Revenue 13,049.5 12,759.6 + 2.3
Expenditure (12,226.6) (11,115.6) + 10.0
Operating profi t 822.9 1,644.0 – 49.9
Finance charges (72.4) (99.7) – 27.4
Interest income 98.2 176.7 – 44.4
Surplus on disposal of aircraft, spares and spare engines 12.6 16.1 – 21.7
Dividends from subsidiary companies 340.3 249.8 + 36.2
Dividends from long-term investments, gross 10.6 18.8 – 43.6
Other non-operating items 40.2 71.9 – 44.1
Profi t before taxation 1,252.4 2,077.6 – 39.7
Taxation expense (147.7) (318.8) – 53.7
Adjustment for reduction in Singapore corporate tax rate 114.0 - n.m.
Profi t after taxation 1,218.7 1,758.8 – 30.7
n.m. not meaningful
FINANCIAL REVIEW