Singapore Airlines 2009 Annual Report Download - page 200
Download and view the complete annual report
Please find page 200 of the 2009 Singapore Airlines annual report below. You can navigate through the pages in the report by either clicking on the pages listed below, or by using the keyword search tool below to find specific information within the annual report.-
 1
1 -
2
-
3
-
4
-
5
-
6
-
7
-
8
-
9
-
10
-
11
-
12
-
13
-
14
-
15
-
16
-
17
-
18
-
19
-
20
-
21
-
22
-
23
-
24
-
25
-
26
-
27
-
28
-
29
-
30
-
31
-
32
-
33
-
34
-
35
-
36
-
37
-
38
-
39
-
40
-
41
-
42
-
43
-
44
-
45
-
46
-
47
-
48
-
49
-
50
-
51
-
52
-
53
-
54
-
55
-
56
-
57
-
58
-
59
-
60
-
61
-
62
-
63
-
64
-
65
-
66
-
67
-
68
-
69
-
70
-
71
-
72
-
73
-
74
-
75
-
76
-
77
-
78
-
79
-
80
-
81
-
82
-
83
-
84
-
85
-
86
-
87
-
88
-
89
-
90
-
91
-
92
-
93
-
94
-
95
-
96
-
97
-
98
-
99
-
100
-
101
-
102
-
103
-
104
-
105
-
106
-
107
-
108
-
109
-
110
-
111
-
112
-
113
-
114
-
115
-
116
-
117
-
118
-
119
-
120
-
121
-
122
-
123
-
124
-
125
-
126
-
127
-
128
-
129
-
130
-
131
-
132
-
133
-
134
-
135
-
136
-
137
-
138
-
139
-
140
-
141
-
142
-
143
-
144
-
145
-
146
-
147
-
148
-
149
-
150
-
151
-
152
-
153
-
154
-
155
-
156
-
157
-
158
-
159
-
160
-
161
-
162
-
163
-
164
-
165
-
166
-
167
-
168
-
169
-
170
-
171
-
172
-
173
-
174
-
175
-
176
-
177
-
178
-
179
-
180
-
181
-
182
-
183
-
184
-
185
-
186
-
187
-
188
-
189
-
 190
190 -
 191
191 -
 192
192 -
 193
193 -
 194
194 -
 195
195 -
 196
196 -
 197
197 -
 198
198 -
 199
199 -
 200
200 -
 201
201 -
 202
202 -
 203
203 -
 204
204 -
 205
205 -
 206
206 -
 207
207 -
 208
208 -
 209
209 -
 210
210 -
211
-
212
-
213
-
214
-
215
-
216
-
217
-
218
-
219
-
220
-
221
-
222
-
223
-
224
 |
 |

198
NOTES TO THE FINANCIAL STATEMENTS
31 March 2009
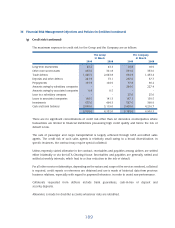
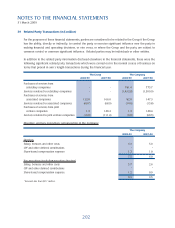
37 Financial Instruments (in $ million) (continued)
(c) Derivative fi nancial instruments and hedging activities (continued)
Fair value through profi t and loss
In addition, there are cross currency swap contracts in place where the Group pays SGD and receives
USD with exchange rates ranging from 1.3085 to 1.6990. These contracts are used to protect the
foreign exchange risk exposure of the Group’s USD-denominated lease liabilities. The maturity period
of these contracts ranges from 21 August 2015 to 14 February 2018.
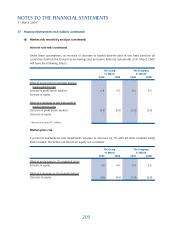
(d) Market risk sensitivity analysis
The Group has used a sensitivity analysis technique that measures the estimated change to the
profi t and loss and equity of either an instantaneous increase or decrease of 0.01% (1 basis point) in
market interest rates or a 1% strengthening or weakening in SGD against all other currencies, from
the rates applicable at 31 March 2009, for each class of fi nancial instrument with all other variables
remaining constant. This analysis is for illustrative purposes only, as in practice, market rates rarely
change in isolation.
Jet fuel price risk
The jet fuel price risk sensitivity analysis is based on the assumption that all other factors, such as
fuel surcharge and uplifted fuel volume, remain constant. Under this assumption, and excluding the
effects of hedging, an increase in price of one US dollar per barrel of jet fuel affects the Group’s and the
Company’s annual fuel costs by $54.4 million and $45.7 million (2007-08: $49.7 million and $40.3
million) respectively.
The fuel hedging sensitivity analysis is based on contracts that are still outstanding as at balance
sheet date and assumes that all jet fuel, gasoil and regrade hedges are highly effective. Under these
assumptions, with an increase or decrease in both jet fuel and gasoil prices, each by one US dollar per
barrel, the before tax effects on equity are as follows:
The Group The Company
31 March 31 March
2009 2008 2009 2008
Effect of an increase in one USD per barrel
Increase in equity 14.3 18.5 11.8 15.1
Effect of a decrease in one USD per barrel
Decrease in equity (14.3) (18.5) (11.8) (15.1)