Singapore Airlines 2009 Annual Report Download - page 52
Download and view the complete annual report
Please find page 52 of the 2009 Singapore Airlines annual report below. You can navigate through the pages in the report by either clicking on the pages listed below, or by using the keyword search tool below to find specific information within the annual report.-
 1
1 -
2
-
3
-
4
-
5
-
6
-
7
-
8
-
9
-
10
-
11
-
12
-
13
-
14
-
15
-
16
-
17
-
18
-
19
-
20
-
21
-
22
-
23
-
24
-
25
-
26
-
27
-
28
-
29
-
30
-
31
-
32
-
33
-
34
-
35
-
36
-
37
-
38
-
39
-
40
-
41
-
 42
42 -
 43
43 -
 44
44 -
 45
45 -
 46
46 -
 47
47 -
 48
48 -
 49
49 -
 50
50 -
 51
51 -
 52
52 -
 53
53 -
 54
54 -
 55
55 -
 56
56 -
 57
57 -
 58
58 -
 59
59 -
 60
60 -
 61
61 -
 62
62 -
63
-
64
-
65
-
66
-
67
-
68
-
69
-
70
-
71
-
72
-
73
-
74
-
75
-
76
-
77
-
78
-
79
-
80
-
81
-
82
-
83
-
84
-
85
-
86
-
87
-
88
-
89
-
90
-
91
-
92
-
93
-
94
-
95
-
96
-
97
-
98
-
99
-
100
-
101
-
102
-
103
-
104
-
105
-
106
-
107
-
108
-
109
-
110
-
111
-
112
-
113
-
114
-
115
-
116
-
117
-
118
-
119
-
120
-
121
-
122
-
123
-
124
-
125
-
126
-
127
-
128
-
129
-
130
-
131
-
132
-
133
-
134
-
135
-
136
-
137
-
138
-
139
-
140
-
141
-
142
-
143
-
144
-
145
-
146
-
147
-
148
-
149
-
150
-
151
-
152
-
153
-
154
-
155
-
156
-
157
-
158
-
159
-
160
-
161
-
162
-
163
-
164
-
165
-
166
-
167
-
168
-
169
-
170
-
171
-
172
-
173
-
174
-
175
-
176
-
177
-
178
-
179
-
180
-
181
-
182
-
183
-
184
-
185
-
186
-
187
-
188
-
189
-
190
-
191
-
192
-
193
-
194
-
195
-
196
-
197
-
198
-
199
-
200
-
201
-
202
-
203
-
204
-
205
-
206
-
207
-
208
-
209
-
210
-
211
-
212
-
213
-
214
-
215
-
216
-
217
-
218
-
219
-
220
-
221
-
222
-
223
-
224
 |
 |
50
FINANCIAL REVIEW
Performance of the Group
Group Earnings
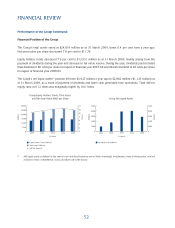
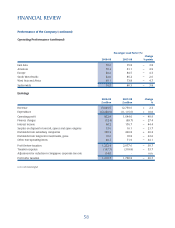
The Group’s performance in FY2008-09 was hit by high price of fuel in the fi rst half of the year and a sharp decline
in cargo and passenger traffi c in the second half of the year. As a result, the Group reported an operating profi t of
$904 million, a year-on-year decline of $1,221 million (-57.5 per cent). This was principally on account of weaker
performance by the Company and the wholly owned cargo company. All the fi ve main operating companies in the
Group posted weaker operating results, with the exception of SIA Engineering Group, which registered a year-on-
year improvement. A summary of the Group’s fi ve main operating companies operating profi t/(loss) is as follows:
• Singapore Airlines Profi t of $823 million (-49.9 per cent)
• Singapore Airport Terminal Services Group Profi t of $171 million (-2.0 per cent)
• SIA Engineering Group Profi t of $113 million (+9.4 per cent)
• SilkAir Profi t of $34 million (-16.0 per cent)
• Singapore Airlines Cargo Loss of $245 million (Profi t of $132 million previously)
Group revenue was up 0.1 per cent to $15,996 million, $24 million higher than the year before.
Group expenditure increased at a faster pace than revenue growth, rising $1,245 million (+9.0 per cent) to
$15,092 million. The increase in expenditure was due mainly to higher fuel cost from increase in jet fuel price.
The increase was partially offset by lower staff cost, due mainly to lower provision for profi t-sharing bonus as a
result of weaker operating performance.
The Group earned a profi t attributable to equity holders of $1,062 million for the fi nancial year ended 31 March
2009, $988 million lower (-48.2 per cent) than the preceding year. This year’s earnings included a one-off write-
back of $138 million in prior years’ deferred tax provision following a reduction in the Singapore corporate tax
rate from 18 per cent to 17 per cent.
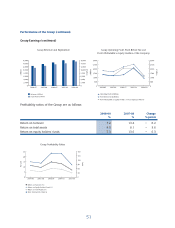
Earnings per share (basic) for the Group fell by 46.8 per cent to 89.6 cents, compared to last year’s earnings per
share of 168.5 cents.