Singapore Airlines 2009 Annual Report Download - page 124
Download and view the complete annual report
Please find page 124 of the 2009 Singapore Airlines annual report below. You can navigate through the pages in the report by either clicking on the pages listed below, or by using the keyword search tool below to find specific information within the annual report.-
 1
1 -
2
-
3
-
4
-
5
-
6
-
7
-
8
-
9
-
10
-
11
-
12
-
13
-
14
-
15
-
16
-
17
-
18
-
19
-
20
-
21
-
22
-
23
-
24
-
25
-
26
-
27
-
28
-
29
-
30
-
31
-
32
-
33
-
34
-
35
-
36
-
37
-
38
-
39
-
40
-
41
-
42
-
43
-
44
-
45
-
46
-
47
-
48
-
49
-
50
-
51
-
52
-
53
-
54
-
55
-
56
-
57
-
58
-
59
-
60
-
61
-
62
-
63
-
64
-
65
-
66
-
67
-
68
-
69
-
70
-
71
-
72
-
73
-
74
-
75
-
76
-
77
-
78
-
79
-
80
-
81
-
82
-
83
-
84
-
85
-
86
-
87
-
88
-
89
-
90
-
91
-
92
-
93
-
94
-
95
-
96
-
97
-
98
-
99
-
100
-
101
-
102
-
103
-
104
-
105
-
106
-
107
-
108
-
109
-
110
-
111
-
112
-
113
-
 114
114 -
 115
115 -
 116
116 -
 117
117 -
 118
118 -
 119
119 -
 120
120 -
 121
121 -
 122
122 -
 123
123 -
 124
124 -
 125
125 -
 126
126 -
 127
127 -
 128
128 -
 129
129 -
 130
130 -
 131
131 -
 132
132 -
 133
133 -
 134
134 -
135
-
136
-
137
-
138
-
139
-
140
-
141
-
142
-
143
-
144
-
145
-
146
-
147
-
148
-
149
-
150
-
151
-
152
-
153
-
154
-
155
-
156
-
157
-
158
-
159
-
160
-
161
-
162
-
163
-
164
-
165
-
166
-
167
-
168
-
169
-
170
-
171
-
172
-
173
-
174
-
175
-
176
-
177
-
178
-
179
-
180
-
181
-
182
-
183
-
184
-
185
-
186
-
187
-
188
-
189
-
190
-
191
-
192
-
193
-
194
-
195
-
196
-
197
-
198
-
199
-
200
-
201
-
202
-
203
-
204
-
205
-
206
-
207
-
208
-
209
-
210
-
211
-
212
-
213
-
214
-
215
-
216
-
217
-
218
-
219
-
220
-
221
-
222
-
223
-
224
 |
 |

122
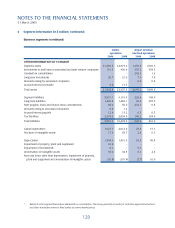
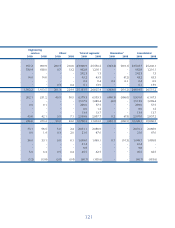
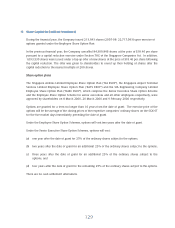
4 Segment Information (in $ million) (continued)
Geographical segments
The following table presents revenue information on airline operations by geographical areas for the
fi nancial years ended 31 March 2009 and 2008.
By area of original sale
2008-09 2007-08
East Asia 5,814.8 6,444.3
Europe 2,319.9 2,158.8
South West Pacifi c 1,937.7 1,906.3
Americas 901.0 1,030.2
West Asia and Africa 856.5 989.4
Systemwide 11,829.9 12,529.0
Non-scheduled services and incidental revenue 3,347.4 2,785.5
15,177.3 15,314.5
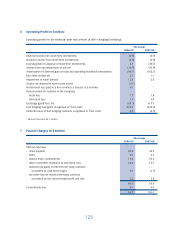
5 Staff Costs (in $ million)
The Group
2008-09 2007-08
Staff costs (including executive directors)
Salary, bonuses and other costs 2,356.7 2,675.6
CPF and other defi ned contributions 120.6 153.9
Share-based compensation expense 68.6 73.9
2,545.9 2,903.4
The Group contributes to several post-employment defi ned benefi t plans for employees at several overseas
locations. Employees may contribute in some of these plans and these contributions are matched in varying
amounts by the Group. Defi ned benefi t expenses for the Group were $14.7 million for 2008-09 and $18.5
million for 2007-08. As these are not material to the total staff costs of the Group for 2008-09 and 2007-
08, additional disclosures of these defi ned benefi t plans are not shown. Disclosures relating to share-based
compensation expense are in Note 13.
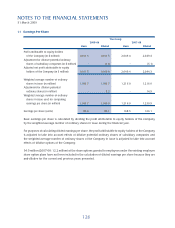
NOTES TO THE FINANCIAL STATEMENTS
31 March 2009