Singapore Airlines 2009 Annual Report Download - page 62
Download and view the complete annual report
Please find page 62 of the 2009 Singapore Airlines annual report below. You can navigate through the pages in the report by either clicking on the pages listed below, or by using the keyword search tool below to find specific information within the annual report.-
 1
1 -
2
-
3
-
4
-
5
-
6
-
7
-
8
-
9
-
10
-
11
-
12
-
13
-
14
-
15
-
16
-
17
-
18
-
19
-
20
-
21
-
22
-
23
-
24
-
25
-
26
-
27
-
28
-
29
-
30
-
31
-
32
-
33
-
34
-
35
-
36
-
37
-
38
-
39
-
40
-
41
-
42
-
43
-
44
-
45
-
46
-
47
-
48
-
49
-
50
-
51
-
 52
52 -
 53
53 -
 54
54 -
 55
55 -
 56
56 -
 57
57 -
 58
58 -
 59
59 -
 60
60 -
 61
61 -
 62
62 -
 63
63 -
 64
64 -
 65
65 -
 66
66 -
 67
67 -
 68
68 -
 69
69 -
 70
70 -
 71
71 -
 72
72 -
73
-
74
-
75
-
76
-
77
-
78
-
79
-
80
-
81
-
82
-
83
-
84
-
85
-
86
-
87
-
88
-
89
-
90
-
91
-
92
-
93
-
94
-
95
-
96
-
97
-
98
-
99
-
100
-
101
-
102
-
103
-
104
-
105
-
106
-
107
-
108
-
109
-
110
-
111
-
112
-
113
-
114
-
115
-
116
-
117
-
118
-
119
-
120
-
121
-
122
-
123
-
124
-
125
-
126
-
127
-
128
-
129
-
130
-
131
-
132
-
133
-
134
-
135
-
136
-
137
-
138
-
139
-
140
-
141
-
142
-
143
-
144
-
145
-
146
-
147
-
148
-
149
-
150
-
151
-
152
-
153
-
154
-
155
-
156
-
157
-
158
-
159
-
160
-
161
-
162
-
163
-
164
-
165
-
166
-
167
-
168
-
169
-
170
-
171
-
172
-
173
-
174
-
175
-
176
-
177
-
178
-
179
-
180
-
181
-
182
-
183
-
184
-
185
-
186
-
187
-
188
-
189
-
190
-
191
-
192
-
193
-
194
-
195
-
196
-
197
-
198
-
199
-
200
-
201
-
202
-
203
-
204
-
205
-
206
-
207
-
208
-
209
-
210
-
211
-
212
-
213
-
214
-
215
-
216
-
217
-
218
-
219
-
220
-
221
-
222
-
223
-
224
 |
 |

60
Performance of the Company (continued)
Revenue (continued)
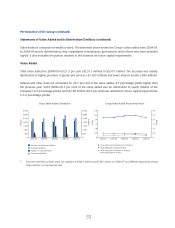
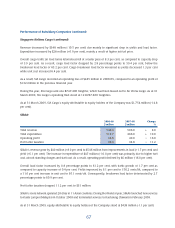
A breakdown of passenger revenueR1 by route region and area of original sale is shown below:
By Route Region ($ million) By Area of Original Sale R2 ($ million)
2008-09 2007-08 % Change 2008-09 2007-08 % Change
East Asia 2,546.4 2,838.1 – 10.3 4,362.4 4,626.9 – 5.7
Americas 1,697.6 1,840.9 – 7.8 740.1 881.5 – 16.0
Europe 2,364.3 2,139.9 + 10.5 2,023.3 1,844.9 + 9.7
South West Pacifi c 1,806.9 1,795.3 + 0.6 1,749.9 1,716.9 + 1.9
West Asia and Africa 1,108.1 1,211.9 – 8.6 647.6 755.9 – 14.3
Systemwide 9,523.3 9,826.1 – 3.1 9,523.3 9,826.1 – 3.1
R1 Includes excess baggage revenue.
R2 Each area of original sale comprises countries within a region from which the sale is made.
FINANCIAL REVIEW