Singapore Airlines 2009 Annual Report Download - page 178
Download and view the complete annual report
Please find page 178 of the 2009 Singapore Airlines annual report below. You can navigate through the pages in the report by either clicking on the pages listed below, or by using the keyword search tool below to find specific information within the annual report.-
 1
1 -
2
-
3
-
4
-
5
-
6
-
7
-
8
-
9
-
10
-
11
-
12
-
13
-
14
-
15
-
16
-
17
-
18
-
19
-
20
-
21
-
22
-
23
-
24
-
25
-
26
-
27
-
28
-
29
-
30
-
31
-
32
-
33
-
34
-
35
-
36
-
37
-
38
-
39
-
40
-
41
-
42
-
43
-
44
-
45
-
46
-
47
-
48
-
49
-
50
-
51
-
52
-
53
-
54
-
55
-
56
-
57
-
58
-
59
-
60
-
61
-
62
-
63
-
64
-
65
-
66
-
67
-
68
-
69
-
70
-
71
-
72
-
73
-
74
-
75
-
76
-
77
-
78
-
79
-
80
-
81
-
82
-
83
-
84
-
85
-
86
-
87
-
88
-
89
-
90
-
91
-
92
-
93
-
94
-
95
-
96
-
97
-
98
-
99
-
100
-
101
-
102
-
103
-
104
-
105
-
106
-
107
-
108
-
109
-
110
-
111
-
112
-
113
-
114
-
115
-
116
-
117
-
118
-
119
-
120
-
121
-
122
-
123
-
124
-
125
-
126
-
127
-
128
-
129
-
130
-
131
-
132
-
133
-
134
-
135
-
136
-
137
-
138
-
139
-
140
-
141
-
142
-
143
-
144
-
145
-
146
-
147
-
148
-
149
-
150
-
151
-
152
-
153
-
154
-
155
-
156
-
157
-
158
-
159
-
160
-
161
-
162
-
163
-
164
-
165
-
166
-
167
-
 168
168 -
 169
169 -
 170
170 -
 171
171 -
 172
172 -
 173
173 -
 174
174 -
 175
175 -
 176
176 -
 177
177 -
 178
178 -
 179
179 -
 180
180 -
 181
181 -
 182
182 -
 183
183 -
 184
184 -
 185
185 -
 186
186 -
 187
187 -
 188
188 -
189
-
190
-
191
-
192
-
193
-
194
-
195
-
196
-
197
-
198
-
199
-
200
-
201
-
202
-
203
-
204
-
205
-
206
-
207
-
208
-
209
-
210
-
211
-
212
-
213
-
214
-
215
-
216
-
217
-
218
-
219
-
220
-
221
-
222
-
223
-
224
 |
 |

176
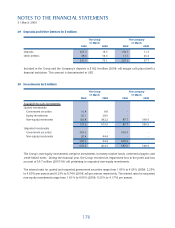
29 Deposits and Other Debtors (in $ million)
The Group The Company
31 March 31 March
2009 2008 2009 2008
Deposits 203.3 18.5 194.3 11.3
Other debtors 38.6 54.6 13.3 26.4
241.9 73.1 207.6 37.7
Included in the Group and the Company’s deposits is $182.4 million (2008: nil) margin calls placed with a
fi nancial institution. This amount is denominated in USD.
30 Investments (in $ million)
The Group The Company
31 March 31 March
2009 2008 2009 2008
Available-for-sale investments
Quoted investments
Government securities 10.4 8.8 - -
Equity investments 20.1 28.9 - -
Non-equity investments 104.8 382.2 87.7 360.9
135.3 419.9 87.7 360.9
Unquoted investments
Government securities 499.9 - 499.9 -
Non-equity investments 20.4 44.4 - -
520.3 44.4 499.9 -
655.6 464.3 587.6 360.9
The Group’s non-equity investments comprise investments in money market funds, commercial papers and
credit-linked notes. During the fi nancial year, the Group recorded an impairment loss in the profi t and loss
account of $9.7 million (2007-08: nil) pertaining to unquoted non-equity investments.
The interest rates for quoted and unquoted government securities range from 1.63% to 4.63% (2008: 2.25%
to 4.63%) per annum and 0.23% to 0.74% (2008: nil) per annum respectively. The interest rates for unquoted
non-equity investments range from 1.81% to 4.00% (2008: 0.25% to 4.17%) per annum.
NOTES TO THE FINANCIAL STATEMENTS
31 March 2009