Singapore Airlines 2009 Annual Report Download - page 57
Download and view the complete annual report
Please find page 57 of the 2009 Singapore Airlines annual report below. You can navigate through the pages in the report by either clicking on the pages listed below, or by using the keyword search tool below to find specific information within the annual report.-
 1
1 -
2
-
3
-
4
-
5
-
6
-
7
-
8
-
9
-
10
-
11
-
12
-
13
-
14
-
15
-
16
-
17
-
18
-
19
-
20
-
21
-
22
-
23
-
24
-
25
-
26
-
27
-
28
-
29
-
30
-
31
-
32
-
33
-
34
-
35
-
36
-
37
-
38
-
39
-
40
-
41
-
42
-
43
-
44
-
45
-
46
-
 47
47 -
 48
48 -
 49
49 -
 50
50 -
 51
51 -
 52
52 -
 53
53 -
 54
54 -
 55
55 -
 56
56 -
 57
57 -
 58
58 -
 59
59 -
 60
60 -
 61
61 -
 62
62 -
 63
63 -
 64
64 -
 65
65 -
 66
66 -
 67
67 -
68
-
69
-
70
-
71
-
72
-
73
-
74
-
75
-
76
-
77
-
78
-
79
-
80
-
81
-
82
-
83
-
84
-
85
-
86
-
87
-
88
-
89
-
90
-
91
-
92
-
93
-
94
-
95
-
96
-
97
-
98
-
99
-
100
-
101
-
102
-
103
-
104
-
105
-
106
-
107
-
108
-
109
-
110
-
111
-
112
-
113
-
114
-
115
-
116
-
117
-
118
-
119
-
120
-
121
-
122
-
123
-
124
-
125
-
126
-
127
-
128
-
129
-
130
-
131
-
132
-
133
-
134
-
135
-
136
-
137
-
138
-
139
-
140
-
141
-
142
-
143
-
144
-
145
-
146
-
147
-
148
-
149
-
150
-
151
-
152
-
153
-
154
-
155
-
156
-
157
-
158
-
159
-
160
-
161
-
162
-
163
-
164
-
165
-
166
-
167
-
168
-
169
-
170
-
171
-
172
-
173
-
174
-
175
-
176
-
177
-
178
-
179
-
180
-
181
-
182
-
183
-
184
-
185
-
186
-
187
-
188
-
189
-
190
-
191
-
192
-
193
-
194
-
195
-
196
-
197
-
198
-
199
-
200
-
201
-
202
-
203
-
204
-
205
-
206
-
207
-
208
-
209
-
210
-
211
-
212
-
213
-
214
-
215
-
216
-
217
-
218
-
219
-
220
-
221
-
222
-
223
-
224
 |
 |

55
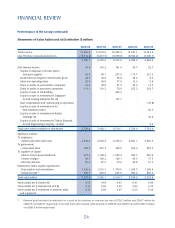
Performance of the Group (continued)
Statements of Value Added and its Distribution ($ million) (continued)
Value added is a measure of wealth created. The statement above shows the Group’s value added from 2004-05
to 2008-09 and its distribution by way of payments to employees, government, and to those who have provided
capital. It also indicates the portion retained in the business for future capital requirements.
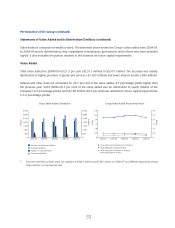
Value Added
Total value added for 2008-09 fell 21.3 per cent (-$1,511 million) to $5,571 million. The decrease was mainly
attributable to higher purchase of goods and services (-$1,397 million) and lower interest income (-$85 million).
Salaries and other staff cost accounted for 45.7 per cent of the value added, 4.7 percentage points higher than
the previous year. $474 million (8.5 per cent) of the value added was for distribution to equity holders of the
Company (-8.2 percentage points) and $2,186 million (39.2 per cent) was retained for future capital requirements
(+5.4 percentage points).
R1 Excludes write-back of prior years’ tax liabilities of $246.7 million and $138.2 million for 2006-07 and 2008-09 respectively arising
from reduction in corporate tax rate.