Johnson Controls 2010 Annual Report Download - page 89
Download and view the complete annual report
Please find page 89 of the 2010 Johnson Controls annual report below. You can navigate through the pages in the report by either clicking on the pages listed below, or by using the keyword search tool below to find specific information within the annual report.-
 1
1 -
2
-
3
-
4
-
5
-
6
-
7
-
8
-
9
-
10
-
11
-
12
-
13
-
14
-
15
-
16
-
17
-
18
-
19
-
20
-
21
-
22
-
23
-
24
-
25
-
26
-
27
-
28
-
29
-
30
-
31
-
32
-
33
-
34
-
35
-
36
-
37
-
38
-
39
-
40
-
41
-
42
-
43
-
44
-
45
-
46
-
47
-
48
-
49
-
50
-
51
-
52
-
53
-
54
-
55
-
56
-
57
-
58
-
59
-
60
-
61
-
62
-
63
-
64
-
65
-
66
-
67
-
68
-
69
-
70
-
71
-
72
-
73
-
74
-
75
-
76
-
77
-
78
-
 79
79 -
 80
80 -
 81
81 -
 82
82 -
 83
83 -
 84
84 -
 85
85 -
 86
86 -
 87
87 -
 88
88 -
 89
89 -
 90
90 -
 91
91 -
 92
92 -
 93
93 -
 94
94 -
 95
95 -
 96
96 -
 97
97 -
 98
98 -
 99
99 -
100
-
101
-
102
-
103
-
104
-
105
-
106
-
107
-
108
-
109
-
110
-
111
-
112
-
113
-
114
 |
 |

89
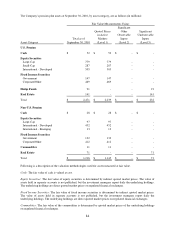
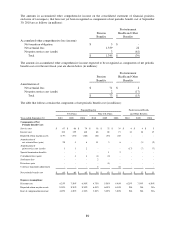
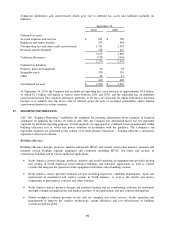
The amounts in accumulated other comprehensive income on the consolidated statement of financial position,
exclusive of tax impacts, that have not yet been recognized as components of net periodic benefit cost at September
30, 2010 are as follows (in millions):
Postretirement
Pension
Health and Other
Benefits
Benefits
Accumulated other comprehensive loss (income)
Net transition obligation
$
3
$
-
Net actuarial loss
1,339
22
Net prior service cost (credit)
3
(61)
Total
$
1,345
$
(39)
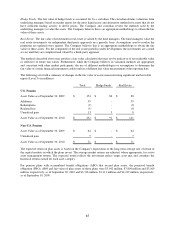
The amounts in accumulated other comprehensive income expected to be recognized as components of net periodic
benefit cost over the next fiscal year are shown below (in millions):
Postretirement
Pension
Health and Other
Benefits
Benefits
Amortization of:
Net actuarial loss
$
71
$
2
Net prior service cost (credit)
2
(17)
Total
$
73
$
(15)
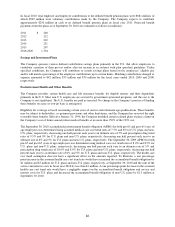
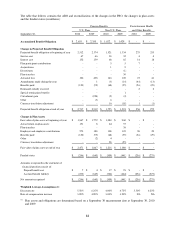
The table that follows contains the components of net periodic benefit cost (in millions):
Pension Benefits
Postretirement Health
U.S. Plans
Non-U.S. Plans
and Other Benefits
Year ended September 30
2010
2009
2008
2010
2009
2008
2010
2009
2008
Components of Net
Periodic Benefit Cost:
Service cost
$
67
$
66
$
79
$
38
$
32
$
39
$
4
$
4
$
5
Interest cost
152
159
140
68
65
73
14
18
17
Expected return on plan assets
(179)
(174)
(166)
(64)
(55)
(67)
-
-
-
Amortization of
net actuarial loss (gain)
28
4
6
11
3
6
-
(3)
(2)
Amortization of
prior service cost (credit)
1
1
2
-
-
-
(17)
(7)
(7)
Special termination benefits
-
-
-
-
1
2
-
-
-
Curtailment loss (gain)
-
4
4
(1)
(2)
-
-
-
-
Settlement loss
-
-
-
2
-
-
-
-
-
Divestures gain
-
-
-
-
(1)
-
-
-
-
Currency translation adjustment
-
-
-
2
-
(2)
-
-
-
Net periodic benefit cost
$
69
$
60
$
65
$
56
$
43
$
51
$
1
$
12
$
13
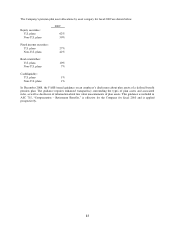
Expense Assumptions:
Discount rate
6.25%
7.50%
6.50%
4.75%
5.50%
4.90%
6.25%
7.50%
6.50%
Expected return on plan assets
8.50%
8.50%
8.50%
6.00%
6.00%
6.10%
NA
NA
NA
Rate of compensation increase
4.20%
4.20%
4.30%
3.20%
3.00%
3.00%
NA
NA
NA