Johnson Controls 2010 Annual Report Download - page 100
Download and view the complete annual report
Please find page 100 of the 2010 Johnson Controls annual report below. You can navigate through the pages in the report by either clicking on the pages listed below, or by using the keyword search tool below to find specific information within the annual report.-
 1
1 -
2
-
3
-
4
-
5
-
6
-
7
-
8
-
9
-
10
-
11
-
12
-
13
-
14
-
15
-
16
-
17
-
18
-
19
-
20
-
21
-
22
-
23
-
24
-
25
-
26
-
27
-
28
-
29
-
30
-
31
-
32
-
33
-
34
-
35
-
36
-
37
-
38
-
39
-
40
-
41
-
42
-
43
-
44
-
45
-
46
-
47
-
48
-
49
-
50
-
51
-
52
-
53
-
54
-
55
-
56
-
57
-
58
-
59
-
60
-
61
-
62
-
63
-
64
-
65
-
66
-
67
-
68
-
69
-
70
-
71
-
72
-
73
-
74
-
75
-
76
-
77
-
78
-
79
-
80
-
81
-
82
-
83
-
84
-
85
-
86
-
87
-
88
-
89
-
 90
90 -
 91
91 -
 92
92 -
 93
93 -
 94
94 -
 95
95 -
 96
96 -
 97
97 -
 98
98 -
 99
99 -
 100
100 -
 101
101 -
 102
102 -
 103
103 -
 104
104 -
 105
105 -
 106
106 -
 107
107 -
 108
108 -
 109
109 -
 110
110 -
111
-
112
-
113
-
114
 |
 |

100
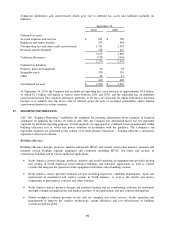
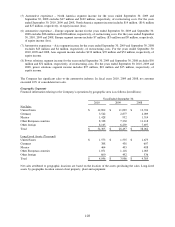
Europe provides HVAC and refrigeration systems and technical services to the European marketplace.
Rest of world provides HVAC and refrigeration systems and technical services to markets in Asia, the
Middle East and Latin America.
Automotive experience
Automotive experience designs and manufactures interior systems and products for passenger cars and light trucks,
including vans, pick-up trucks and sport utility/crossover vehicles in North America, Europe and Asia. Automotive
experience systems and products include complete seating systems and components; cockpit systems, including
instrument panels and clusters, information displays and body controllers; overhead systems, including headliners
and electronic convenience features; floor consoles; and door systems.
Power solutions
Power solutions services both automotive original equipment manufacturers and the battery aftermarket by
providing advanced battery technology, coupled with systems engineering, marketing and service expertise.
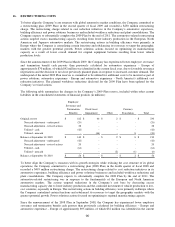
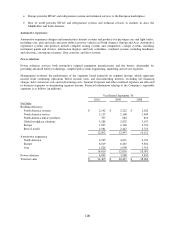
Management evaluates the performance of the segments based primarily on segment income, which represents
income from continuing operations before income taxes and noncontrolling interests excluding net financing
charges, debt conversion costs and restructuring costs. General Corporate and other overhead expenses are allocated
to business segments in determining segment income. Financial information relating to the Company’s reportable
segments is as follows (in millions):
Year Ended September 30,
2010
2009
2008
Net Sales
Building efficiency
North America systems
$
2,142
$
2,222
$
2,282
North America service
2,127
2,168
2,409
North America unitary products
787
684
810
Global workplace solutions
3,288
2,832
3,197
Europe
1,897
2,140
2,710
Rest of world
2,561
2,447
2,713
12,802
12,493
14,121
Automotive experience
North America
6,765
4,631
6,723
Europe
8,019
6,287
9,854
Asia
1,826
1,098
1,514
16,610
12,016
18,091
Power solutions
4,893
3,988
5,850
Total net sales
$
34,305
$
28,497
$
38,062