Johnson Controls 2010 Annual Report Download - page 81
Download and view the complete annual report
Please find page 81 of the 2010 Johnson Controls annual report below. You can navigate through the pages in the report by either clicking on the pages listed below, or by using the keyword search tool below to find specific information within the annual report.-
 1
1 -
2
-
3
-
4
-
5
-
6
-
7
-
8
-
9
-
10
-
11
-
12
-
13
-
14
-
15
-
16
-
17
-
18
-
19
-
20
-
21
-
22
-
23
-
24
-
25
-
26
-
27
-
28
-
29
-
30
-
31
-
32
-
33
-
34
-
35
-
36
-
37
-
38
-
39
-
40
-
41
-
42
-
43
-
44
-
45
-
46
-
47
-
48
-
49
-
50
-
51
-
52
-
53
-
54
-
55
-
56
-
57
-
58
-
59
-
60
-
61
-
62
-
63
-
64
-
65
-
66
-
67
-
68
-
69
-
70
-
 71
71 -
 72
72 -
 73
73 -
 74
74 -
 75
75 -
 76
76 -
 77
77 -
 78
78 -
 79
79 -
 80
80 -
 81
81 -
 82
82 -
 83
83 -
 84
84 -
 85
85 -
 86
86 -
 87
87 -
 88
88 -
 89
89 -
 90
90 -
 91
91 -
92
-
93
-
94
-
95
-
96
-
97
-
98
-
99
-
100
-
101
-
102
-
103
-
104
-
105
-
106
-
107
-
108
-
109
-
110
-
111
-
112
-
113
-
114
 |
 |

81
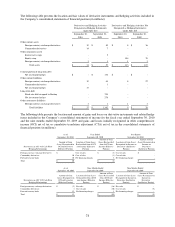
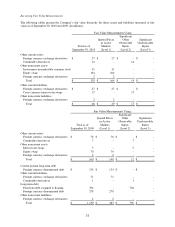
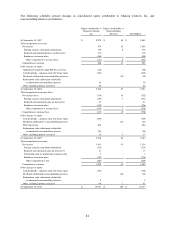
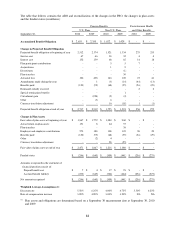
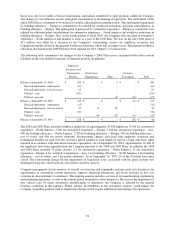
The following schedules present changes in consolidated equity attributable to Johnson Controls, Inc. and
noncontrolling interests (in millions):
Equity Attributable to
Johnson Controls,
Inc.
Equity Attributable to
Noncontrolling
Interests
Total Equity
At September 30, 2007
$
8,873
$
88
$
8,961
Total comprehensive income:
Net income
979
25
1,004
Foreign currency translation adjustments
170
8
178
Realized and unrealized losses on derivatives
(93)
-
(93)
Employee retirement plans
(188)
-
(188)
Other comprehensive income (loss)
(111)
8
(103)
Comprehensive income
868
33
901
Other changes in equity:
Adjustment to initially adopt FIN 48, net of tax
(68)
-
(68)
Cash dividends - common stock ($0.52 per share)
(309)
-
(309)
Dividends attributable to noncontrolling interests
-
(34)
(34)
Redemption value adjustment attributable
to redeemable noncontrolling interests
16
-
16
Other, including options exercised
26
-
26
At September 30, 2008
9,406
87
9,493
Total comprehensive income (loss):
Net income (loss)
(338)
16
(322)
Foreign currency translation adjustments
(194)
3
(191)
Realized and unrealized gains on derivatives
41
-
41
Employee retirement plans
(326)
-
(326)
Other comprehensive income (loss)
(479)
3
(476)
Comprehensive income (loss)
(817)
19
(798)
Other changes in equity:
Cash dividends - common stock ($0.52 per share)
(309)
-
(309)
Dividends attributable to noncontrolling interests
-
(23)
(23)
Debt conversion
804
-
804
Redemption value adjustment attributable
to redeemable noncontrolling interests
(20)
-
(20)
Other, including options exercised
36
1
37
At September 30, 2009
9,100
84
9,184
Total comprehensive income:
Net income
1,491
43
1,534
Foreign currency translation adjustments
(115)
-
(115)
Realized and unrealized gains on derivatives
13
-
13
Unrealized gains on marketable common stock
3
-
3
Employee retirement plans
(170)
-
(170)
Other comprehensive loss
(269)
-
(269)
Comprehensive income
1,222
43
1,265
Other changes in equity:
Cash dividends - common stock ($0.52 per share)
(350)
-
(350)
Dividends attributable to noncontrolling interests
-
(22)
(22)
Redemption value adjustment attributable
to redeemable noncontrolling interests
9
-
9
Other, including options exercised
90
1
91
At September 30, 2010
$
10,071
$
106
$
10,177