Johnson Controls 2010 Annual Report Download - page 23
Download and view the complete annual report
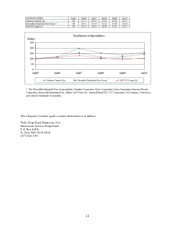
Please find page 23 of the 2010 Johnson Controls annual report below. You can navigate through the pages in the report by either clicking on the pages listed below, or by using the keyword search tool below to find specific information within the annual report.-
 1
1 -
2
-
3
-
4
-
5
-
6
-
7
-
8
-
9
-
10
-
11
-
12
-
 13
13 -
 14
14 -
 15
15 -
 16
16 -
 17
17 -
 18
18 -
 19
19 -
 20
20 -
 21
21 -
 22
22 -
 23
23 -
 24
24 -
 25
25 -
 26
26 -
 27
27 -
 28
28 -
 29
29 -
 30
30 -
 31
31 -
 32
32 -
 33
33 -
34
-
35
-
36
-
37
-
38
-
39
-
40
-
41
-
42
-
43
-
44
-
45
-
46
-
47
-
48
-
49
-
50
-
51
-
52
-
53
-
54
-
55
-
56
-
57
-
58
-
59
-
60
-
61
-
62
-
63
-
64
-
65
-
66
-
67
-
68
-
69
-
70
-
71
-
72
-
73
-
74
-
75
-
76
-
77
-
78
-
79
-
80
-
81
-
82
-
83
-
84
-
85
-
86
-
87
-
88
-
89
-
90
-
91
-
92
-
93
-
94
-
95
-
96
-
97
-
98
-
99
-
100
-
101
-
102
-
103
-
104
-
105
-
106
-
107
-
108
-
109
-
110
-
111
-
112
-
113
-
114
 |
 |

23
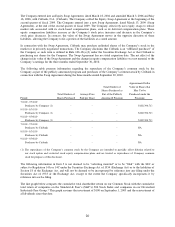
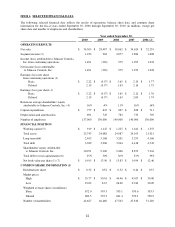
(1) All share and per share amounts reflect a three-for-one common stock split payable October 2, 2007 to
shareholders of record on September 14, 2007.
(2) In December 2005, the Company acquired York International Corporation, significantly expanding the building
efficiency business.
(3) Segment income is calculated as income from continuing operations before income taxes and noncontrolling
interests excluding net financing charges, debt conversion costs and restructuring costs.
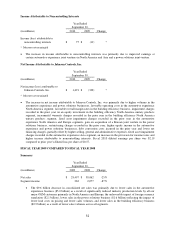
(4) Return on average shareholders’ equity attributable to Johnson Controls, Inc. (ROE) represents income from
continuing operations divided by average shareholders’ equity attributable to Johnson Controls, Inc. Income
from continuing operations includes $230 million, $495 million and $197 million of restructuring costs in fiscal
year 2009, 2008 and 2006, respectively.
(5) Working capital is defined as current assets less current liabilities, excluding cash, short-term debt, the current
portion of long-term debt and net assets of discontinued operations.
(6) Total debt to total capitalization represents total debt divided by the sum of total debt and shareholders’ equity
attributable to Johnson Controls, Inc.
(7) Net book value per share represents shareholders’ equity attributable to Johnson Controls, Inc. divided by the
number of common shares outstanding at the end of the period.
ITEM 7 MANAGEMENT'S DISCUSSION AND ANALYSIS OF FINANCIAL CONDITION AND
RESULTS OF OPERATIONS
General
The Company operates in three primary businesses: building efficiency, automotive experience and power solutions.
Building efficiency provides facility systems, services and workplace solutions including comfort, energy and
security management for the residential and non-residential buildings markets. Automotive experience designs and
manufactures interior systems and products for passenger cars and light trucks, including vans, pick-up trucks and
sport/crossover utility vehicles. Power solutions designs and manufactures automotive batteries for the replacement
and original equipment markets.
This discussion summarizes the significant factors affecting the consolidated operating results, financial condition
and liquidity of the Company for the three-year period ended September 30, 2010. This discussion should be read in
conjunction with Item 8, the consolidated financial statements and notes to the consolidated financial statements.
Executive Overview
In fiscal 2010, the Company recorded net sales of $34.3 billion, a 20% increase from the prior year. Net income
attributable to Johnson Controls, Inc. was $1.5 billion, $1.8 billion higher than prior year’s net loss attributable to
Johnson Controls, Inc. of $338 million. The increase is primarily the result of significantly increased industry
production volumes in the automotive markets and growth in energy solutions markets. The Company experienced
market share gains and improved margins in all three businesses and benefited from cost reduction initiatives. The
Company continues to introduce new and enhanced technology applications in all businesses and markets served,
while at the same time improving the quality of its products.
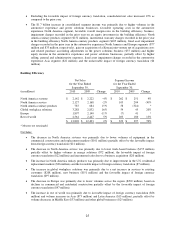
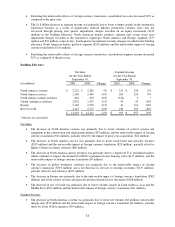
Building efficiency business net sales and segment income increased 2% and 70%, respectively, compared to the
prior year primarily due to growth in the rest of world and energy solutions markets, modest recovery in
construction spending and residential HVAC demand, and the favorable impact of foreign currency translation.
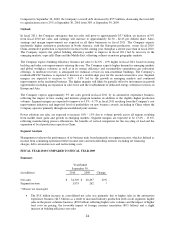
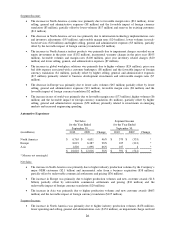
The automotive experience business was favorably impacted by higher automobile production in all segments. Net
sales increased 38% from the prior year and segment income increased from a loss of $541 million in the prior year
to a profit of $591 million in the current year.
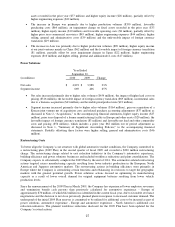
Net sales and segment income for the power solutions business increased by 23% and 65%, respectively, compared
to the prior year primarily due to increased demand, higher unit prices resulting from increases in the cost of lead,
and the favorable impact of foreign currency translation.