Johnson Controls 2010 Annual Report Download - page 66
Download and view the complete annual report
Please find page 66 of the 2010 Johnson Controls annual report below. You can navigate through the pages in the report by either clicking on the pages listed below, or by using the keyword search tool below to find specific information within the annual report.-
 1
1 -
2
-
3
-
4
-
5
-
6
-
7
-
8
-
9
-
10
-
11
-
12
-
13
-
14
-
15
-
16
-
17
-
18
-
19
-
20
-
21
-
22
-
23
-
24
-
25
-
26
-
27
-
28
-
29
-
30
-
31
-
32
-
33
-
34
-
35
-
36
-
37
-
38
-
39
-
40
-
41
-
42
-
43
-
44
-
45
-
46
-
47
-
48
-
49
-
50
-
51
-
52
-
53
-
54
-
55
-
 56
56 -
 57
57 -
 58
58 -
 59
59 -
 60
60 -
 61
61 -
 62
62 -
 63
63 -
 64
64 -
 65
65 -
 66
66 -
 67
67 -
 68
68 -
 69
69 -
 70
70 -
 71
71 -
 72
72 -
 73
73 -
 74
74 -
 75
75 -
 76
76 -
77
-
78
-
79
-
80
-
81
-
82
-
83
-
84
-
85
-
86
-
87
-
88
-
89
-
90
-
91
-
92
-
93
-
94
-
95
-
96
-
97
-
98
-
99
-
100
-
101
-
102
-
103
-
104
-
105
-
106
-
107
-
108
-
109
-
110
-
111
-
112
-
113
-
114
 |
 |

66
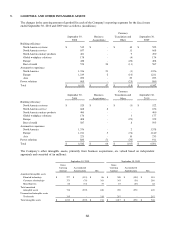
5. GOODWILL AND OTHER INTANGIBLE ASSETS
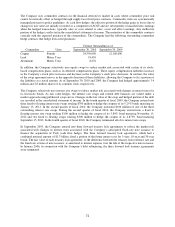
The changes in the carrying amount of goodwill in each of the Company’s reporting segments for the fiscal years
ended September 30, 2010 and 2009 were as follows (in millions):
Currency
September 30,
Business
Translation and
September 30,
2008
Acquisitions
Other
2009
Building efficiency
North America systems
$
515
$
-
$
10
$
525
North America service
657
-
11
668
North America unitary products
481
-
9
490
Global workplace solutions
178
-
(4)
174
Europe
428
-
(20)
408
Rest of world
574
24
(11)
587
Automotive experience
North America
1,356
21
(1)
1,376
Europe
1,219
2
(10)
1,211
Asia
200
-
23
223
Power solutions
905
-
(25)
880
Total
$
6,513
$
47
$
(18)
$
6,542
Currency
September 30,
Business
Translation and
September 30,
2009
Acquisitions
Other
2010
Building efficiency
North America systems
$
525
$
-
$
(3)
$
522
North America service
668
8
-
676
North America unitary products
490
-
-
490
Global workplace solutions
174
-
3
177
Europe
408
-
(29)
379
Rest of world
587
-
8
595
Automotive experience
North America
1,376
-
2
1,378
Europe
1,211
5
(76)
1,140
Asia
223
-
10
233
Power solutions
880
51
(20)
911
Total
$
6,542
$
64
$
(105)
$
6,501
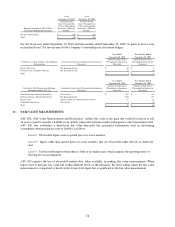
The Company’s other intangible assets, primarily from business acquisitions, are valued based on independent
appraisals and consisted of (in millions):
September 30, 2010
September 30, 2009
Gross
Gross
Carrying
Accumulated
Carrying
Accumulated
Amount
Amortization
Net
Amount
Amortization
Net
Amortized intangible assets
Patented technology
$
277
$
(191)
$
86
$
308
$
(190)
$
118
Customer relationships
373
(70)
303
345
(56)
289
Miscellaneous
68
(31)
37
67
(25)
42
Total amortized
intangible assets
718
(292)
426
720
(271)
449
Unamortized intangible assets
Trademarks
315
-
315
297
-
297
Total intangible assets
$
1,033
$
(292)
$
741
$
1,017
$
(271)
$
746