Johnson Controls 2010 Annual Report Download - page 55
Download and view the complete annual report
Please find page 55 of the 2010 Johnson Controls annual report below. You can navigate through the pages in the report by either clicking on the pages listed below, or by using the keyword search tool below to find specific information within the annual report.-
 1
1 -
2
-
3
-
4
-
5
-
6
-
7
-
8
-
9
-
10
-
11
-
12
-
13
-
14
-
15
-
16
-
17
-
18
-
19
-
20
-
21
-
22
-
23
-
24
-
25
-
26
-
27
-
28
-
29
-
30
-
31
-
32
-
33
-
34
-
35
-
36
-
37
-
38
-
39
-
40
-
41
-
42
-
43
-
44
-
 45
45 -
 46
46 -
 47
47 -
 48
48 -
 49
49 -
 50
50 -
 51
51 -
 52
52 -
 53
53 -
 54
54 -
 55
55 -
 56
56 -
 57
57 -
 58
58 -
 59
59 -
 60
60 -
 61
61 -
 62
62 -
 63
63 -
 64
64 -
 65
65 -
66
-
67
-
68
-
69
-
70
-
71
-
72
-
73
-
74
-
75
-
76
-
77
-
78
-
79
-
80
-
81
-
82
-
83
-
84
-
85
-
86
-
87
-
88
-
89
-
90
-
91
-
92
-
93
-
94
-
95
-
96
-
97
-
98
-
99
-
100
-
101
-
102
-
103
-
104
-
105
-
106
-
107
-
108
-
109
-
110
-
111
-
112
-
113
-
114
 |
 |

55
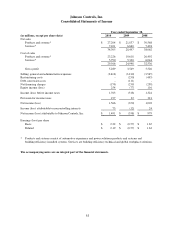
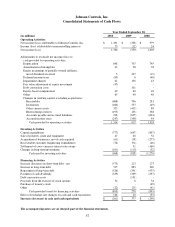
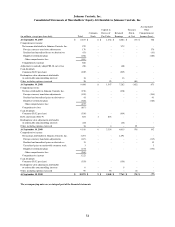
Johnson Controls, Inc.
Consolidated Statements of Income
Year ended September 30,
(in millions, except per share data)
2010
2009
2008
Net sales
Products and systems*
$
27,204
$
21,837
$
30,568
Services*
7,101
6,660
7,494
34,305
28,497
38,062
Cost of sales
Products and systems*
23,226
19,618
26,492
Services*
5,790
5,330
6,044
29,016
24,948
32,536
Gross profit
5,289
3,549
5,526
Selling, general and administrative expenses
(3,610)
(3,210)
(3,565)
Restructuring costs
-
(230)
(495)
Debt conversion costs
-
(111)
-
Net financing charges
(170)
(239)
(258)
Equity income (loss)
254
(77)
116
Income (loss) before income taxes
1,763
(318)
1,324
Provision for income taxes
197
32
321
Net income (loss)
1,566
(350)
1,003
Income (loss) attributable to noncontrolling interests
75
(12)
24
Net income (loss) attributable to Johnson Controls, Inc.
$
1,491
$
(338)
$
979
Earnings (loss) per share
Basic
$
2.22
$
(0.57)
$
1.65
Diluted
$
2.19
$
(0.57)
$
1.63
*
Products and systems consist of automotive experience and power solutions products and systems and
building efficiency installed systems. Services are building efficiency technical and global workplace solutions.
The accompanying notes are an integral part of the financial statements.