Johnson Controls 2010 Annual Report Download - page 103
Download and view the complete annual report
Please find page 103 of the 2010 Johnson Controls annual report below. You can navigate through the pages in the report by either clicking on the pages listed below, or by using the keyword search tool below to find specific information within the annual report.-
 1
1 -
2
-
3
-
4
-
5
-
6
-
7
-
8
-
9
-
10
-
11
-
12
-
13
-
14
-
15
-
16
-
17
-
18
-
19
-
20
-
21
-
22
-
23
-
24
-
25
-
26
-
27
-
28
-
29
-
30
-
31
-
32
-
33
-
34
-
35
-
36
-
37
-
38
-
39
-
40
-
41
-
42
-
43
-
44
-
45
-
46
-
47
-
48
-
49
-
50
-
51
-
52
-
53
-
54
-
55
-
56
-
57
-
58
-
59
-
60
-
61
-
62
-
63
-
64
-
65
-
66
-
67
-
68
-
69
-
70
-
71
-
72
-
73
-
74
-
75
-
76
-
77
-
78
-
79
-
80
-
81
-
82
-
83
-
84
-
85
-
86
-
87
-
88
-
89
-
90
-
91
-
92
-
 93
93 -
 94
94 -
 95
95 -
 96
96 -
 97
97 -
 98
98 -
 99
99 -
 100
100 -
 101
101 -
 102
102 -
 103
103 -
 104
104 -
 105
105 -
 106
106 -
 107
107 -
 108
108 -
 109
109 -
 110
110 -
 111
111 -
 112
112 -
 113
113 -
114
 |
 |

103
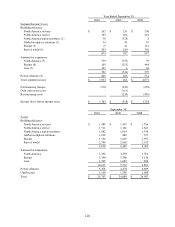
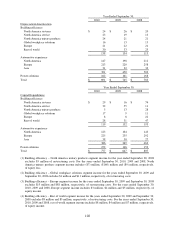
(5) Automotive experience – North America segment income for the years ended September 30, 2009 and
September 30, 2008 excludes $47 million and $102 million, respectively, of restructuring costs. For the years
ended September 30, 2010, 2009 and 2008, North America segment income includes $14 million, ($14) million
and $27 million, respectively, of equity income (loss).
(6) Automotive experience – Europe segment income for the years ended September 30, 2009 and September 30,
2008 excludes $86 million and $208 million, respectively, of restructuring costs. For the years ended September
30, 2010, 2009 and 2008, Europe segment income includes $7 million, ($3) million and $9 million, respectively,
of equity income (loss).
(7) Automotive experience – Asia segment income for the years ended September 30, 2009 and September 30, 2008
excludes $23 million and $4 million, respectively, of restructuring costs. For the years ended September 30,
2010, 2009 and 2008, Asia segment income includes $132 million, $70 million and $52 million, respectively, of
equity income.
(8) Power solutions segment income for the years ended September 30, 2009 and September 30, 2008 excludes $50
million and $72 million, respectively, of restructuring costs. For the years ended September 30, 2010, 2009 and
2008, power solutions segment income includes $97 million, $22 million and $25 million, respectively, of
equity income.
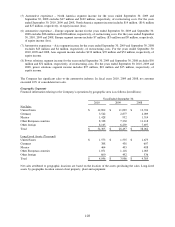
The Company has significant sales to the automotive industry. In fiscal years 2010, 2009 and 2008, no customer
exceeded 10% of consolidated net sales.
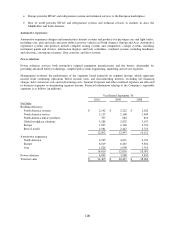
Geographic Segments
Financial information relating to the Company’s operations by geographic area is as follows (in millions):
Year Ended September 30,
2010
2009
2008
Net Sales
United States
$
12,892
$
11,099
$
13,724
Germany
3,542
2,877
4,009
Mexico
1,428
952
1,514
Other European countries
8,338
7,330
11,118
Other foreign
8,105
6,239
7,697
Total
$
34,305
$
28,497
$
38,062
Long-Lived Assets (Year-end)
United States
$
1,573
$
1,535
$
1,675
Germany
388
438
607
Mexico
464
403
488
Other European countries
1,071
1,118
1,083
Other foreign
600
492
536
Total
$
4,096
$
3,986
$
4,389
Net sales attributed to geographic locations are based on the location of the assets producing the sales. Long-lived
assets by geographic location consist of net property, plant and equipment.