Johnson Controls 2010 Annual Report Download - page 86
Download and view the complete annual report
Please find page 86 of the 2010 Johnson Controls annual report below. You can navigate through the pages in the report by either clicking on the pages listed below, or by using the keyword search tool below to find specific information within the annual report.-
 1
1 -
2
-
3
-
4
-
5
-
6
-
7
-
8
-
9
-
10
-
11
-
12
-
13
-
14
-
15
-
16
-
17
-
18
-
19
-
20
-
21
-
22
-
23
-
24
-
25
-
26
-
27
-
28
-
29
-
30
-
31
-
32
-
33
-
34
-
35
-
36
-
37
-
38
-
39
-
40
-
41
-
42
-
43
-
44
-
45
-
46
-
47
-
48
-
49
-
50
-
51
-
52
-
53
-
54
-
55
-
56
-
57
-
58
-
59
-
60
-
61
-
62
-
63
-
64
-
65
-
66
-
67
-
68
-
69
-
70
-
71
-
72
-
73
-
74
-
75
-
 76
76 -
 77
77 -
 78
78 -
 79
79 -
 80
80 -
 81
81 -
 82
82 -
 83
83 -
 84
84 -
 85
85 -
 86
86 -
 87
87 -
 88
88 -
 89
89 -
 90
90 -
 91
91 -
 92
92 -
 93
93 -
 94
94 -
 95
95 -
 96
96 -
97
-
98
-
99
-
100
-
101
-
102
-
103
-
104
-
105
-
106
-
107
-
108
-
109
-
110
-
111
-
112
-
113
-
114
 |
 |

86
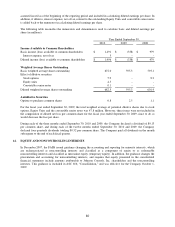
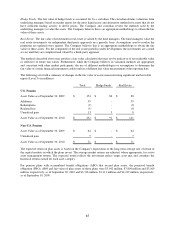
In fiscal 2010, total employer and employee contributions to the defined benefit pension plans were $681 million, of
which $509 million were voluntary contributions made by the Company. The Company expects to contribute
approximately $250 million in cash to its defined benefit pension plans in fiscal year 2011. Projected benefit
payments from the plans as of September 30, 2010 are estimated as follows (in millions):
2011
$
240
2012
212
2013
222
2014
231
2015
247
2016-2020
1,334
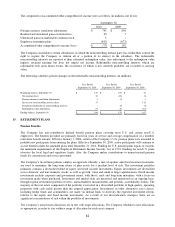
Savings and Investment Plans
The Company sponsors various defined contribution savings plans primarily in the U.S. that allow employees to
contribute a portion of their pre-tax and/or after-tax income in accordance with plan specified guidelines. Under
specified conditions, the Company will contribute to certain savings plans based on the employees’ eligible pay
and/or will match a percentage of the employee contributions up to certain limits. Matching contributions charged to
expense amounted to $42 million, $35 million and $39 million for the fiscal years ended 2010, 2009 and 2008,
respectively.
Postretirement Health and Other Benefits
The Company provides certain health care and life insurance benefits for eligible retirees and their dependents
primarily in the U.S. Most non-U.S. employees are covered by government sponsored programs, and the cost to the
Company is not significant. The U.S. benefits are paid as incurred. No change in the Company’s practice of funding
these benefits on a pay-as-you-go basis is anticipated.
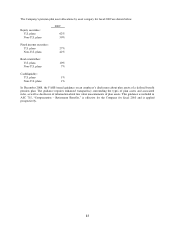
Eligibility for coverage is based on meeting certain years of service and retirement age qualifications. These benefits
may be subject to deductibles, co-payment provisions and other limitations, and the Company has reserved the right
to modify these benefits. Effective January 31, 1994, the Company modified certain salaried plans to place a limit on
the Company's cost of future annual retiree medical benefits at no more than 150% of the 1993 cost.
The September 30, 2010 accumulated postretirement benefit obligation (APBO) for both pre-65 and post-65 years of
age employees was determined using assumed medical care cost trend rates of 7.5% and 8% for U.S. plans and non-
U.S. plans, respectively, decreasing one half percent each year to an ultimate rate of 5% and prescription drug trend
rates of 9.5% and 8% for U.S. plans and non-U.S. plans, respectively, decreasing one half percent each year to an
ultimate rate of 6% and 5% for U.S. plans and non-U.S. plans, respectively. The September 30, 2009 APBO for both
pre-65 and post-65 years of age employees was determined using medical care cost trend rates of 8.0% and 8.5% for
U.S. plans and non-U.S. plans, respectively, decreasing one half percent each year to an ultimate rate of 5% and
prescription drug trend rates of 10.0% and 8.5% for U.S. plans and non-U.S. plans, respectively, decreasing one half
percent each year to an ultimate rate of 6% and 5% for U.S. plans and non-U.S. plans, respectively. The health care
cost trend assumption does not have a significant effect on the amounts reported. To illustrate, a one percentage
point increase in the assumed health care cost trend rate would have increased the accumulated benefit obligation by
$1 million and $3 million for U.S. plans and non-U.S. plans, respectively, at September 30, 2010 and the sum of the
service and interest costs in fiscal year 2010 by less than $1 million. A one percentage point decrease in the assumed
health care cost trend rate would have a negligible impact on the accumulated benefit obligation and service and
interest costs for U.S. plans and decreased the accumulated benefit obligation of non-U.S. plans by $2.5 million at
September 30, 2010.