Johnson Controls 2010 Annual Report Download - page 88
Download and view the complete annual report
Please find page 88 of the 2010 Johnson Controls annual report below. You can navigate through the pages in the report by either clicking on the pages listed below, or by using the keyword search tool below to find specific information within the annual report.-
 1
1 -
2
-
3
-
4
-
5
-
6
-
7
-
8
-
9
-
10
-
11
-
12
-
13
-
14
-
15
-
16
-
17
-
18
-
19
-
20
-
21
-
22
-
23
-
24
-
25
-
26
-
27
-
28
-
29
-
30
-
31
-
32
-
33
-
34
-
35
-
36
-
37
-
38
-
39
-
40
-
41
-
42
-
43
-
44
-
45
-
46
-
47
-
48
-
49
-
50
-
51
-
52
-
53
-
54
-
55
-
56
-
57
-
58
-
59
-
60
-
61
-
62
-
63
-
64
-
65
-
66
-
67
-
68
-
69
-
70
-
71
-
72
-
73
-
74
-
75
-
76
-
77
-
 78
78 -
 79
79 -
 80
80 -
 81
81 -
 82
82 -
 83
83 -
 84
84 -
 85
85 -
 86
86 -
 87
87 -
 88
88 -
 89
89 -
 90
90 -
 91
91 -
 92
92 -
 93
93 -
 94
94 -
 95
95 -
 96
96 -
 97
97 -
 98
98 -
99
-
100
-
101
-
102
-
103
-
104
-
105
-
106
-
107
-
108
-
109
-
110
-
111
-
112
-
113
-
114
 |
 |

88
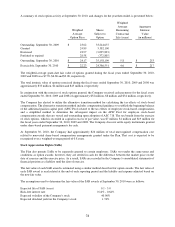
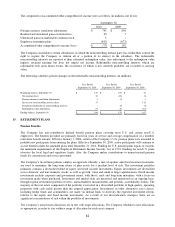
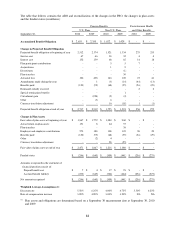
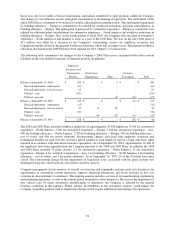
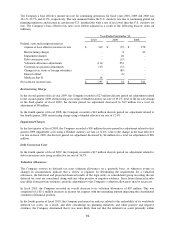
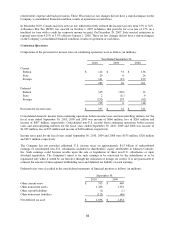
The table that follows contains the ABO and reconciliations of the changes in the PBO, the changes in plan assets
and the funded status (in millions):
Pension Benefits
Postretirement Health
U.S. Plans
Non-U.S. Plans
and Other Benefits
September 30,
2010
2009
2010
2009
2010
2009
Accumulated Benefit Obligation
$
2,655
$
2,355
$
1,622
$
1,429
$
-
$
-
Change in Projected Benefit Obligation
Projected benefit obligation at beginning of year
2,512
2,174
1,521
1,334
275
253
Service cost
67
66
38
32
4
4
Interest cost
152
159
68
65
14
18
Plan participant contributions
-
-
5
5
7
-
Acquisitions
-
-
1
9
-
-
Divestitures
-
-
-
(1)
-
-
Plan transfers
-
-
-
39
-
-
Actuarial loss
106
438
146
128
23
41
Amendments made during the year
-
1
(3)
(14)
(44)
(13)
Benefits paid
(120)
(99)
(68)
(55)
(26)
(29)
Estimated subsidy received
-
-
-
-
2
2
Special termination benefits
-
-
-
1
-
-
Curtailment gain
-
(224)
(5)
(4)
-
-
Other
-
(3)
6
-
-
-
Currency translation adjustment
-
-
16
(18)
1
(1)
Projected benefit obligation at end of year
$
2,717
$
2,512
$
1,725
$
1,521
$
256
$
275
Change in Plan Assets
Fair value of plan assets at beginning of year
$
1,867
$
1,772
$
1,080
$
960
$
-
$
-
Actual return on plan assets
151
8
64
57
-
-
Plan transfers
-
-
-
38
-
-
Employer and employee contributions
573
188
108
105
26
29
Benefits paid
(120)
(99)
(68)
(55)
(26)
(29)
Other
-
(2)
4
-
-
-
Currency translation adjustment
-
-
28
(25)
-
-
Fair value of plan assets at end of year
$
2,471
$
1,867
$
1,216
$
1,080
$
-
$
-
Funded status
$
(246)
$
(645)
$
(509)
$
(441)
$
(256)
$
(275)
Amounts recognized in the statement of
financial position consist of:
Prepaid benefit cost
$
7
$
4
$
17
$
23
$
-
$
-
Accrued benefit liability
(253)
(649)
(526)
(464)
(256)
(275)
Net amount recognized
$
(246)
$
(645)
$
(509)
$
(441)
$
(256)
$
(275)
Weighted Average Assumptions (1)
Discount rate
5.50%
6.25%
4.00%
4.75%
5.50%
6.25%
Rate of compensation increase
3.20%
4.20%
3.00%
3.20%
NA
NA
(1) Plan assets and obligations are determined based on a September 30 measurement date at September 30, 2010
and 2009.