Johnson Controls 2010 Annual Report Download - page 24
Download and view the complete annual report
Please find page 24 of the 2010 Johnson Controls annual report below. You can navigate through the pages in the report by either clicking on the pages listed below, or by using the keyword search tool below to find specific information within the annual report.-
 1
1 -
2
-
3
-
4
-
5
-
6
-
7
-
8
-
9
-
10
-
11
-
12
-
13
-
 14
14 -
 15
15 -
 16
16 -
 17
17 -
 18
18 -
 19
19 -
 20
20 -
 21
21 -
 22
22 -
 23
23 -
 24
24 -
 25
25 -
 26
26 -
 27
27 -
 28
28 -
 29
29 -
 30
30 -
 31
31 -
 32
32 -
 33
33 -
 34
34 -
35
-
36
-
37
-
38
-
39
-
40
-
41
-
42
-
43
-
44
-
45
-
46
-
47
-
48
-
49
-
50
-
51
-
52
-
53
-
54
-
55
-
56
-
57
-
58
-
59
-
60
-
61
-
62
-
63
-
64
-
65
-
66
-
67
-
68
-
69
-
70
-
71
-
72
-
73
-
74
-
75
-
76
-
77
-
78
-
79
-
80
-
81
-
82
-
83
-
84
-
85
-
86
-
87
-
88
-
89
-
90
-
91
-
92
-
93
-
94
-
95
-
96
-
97
-
98
-
99
-
100
-
101
-
102
-
103
-
104
-
105
-
106
-
107
-
108
-
109
-
110
-
111
-
112
-
113
-
114
 |
 |

24
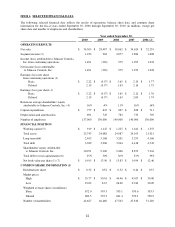
Compared to September 30, 2009, the Company’s overall debt decreased by $577 million, decreasing the total debt
to capitalization ratio to 25% at September 30, 2010 from 30% at September 30, 2009.
Outlook
In fiscal 2011, the Company anticipates that net sales will grow to approximately $37 billion, an increase of 9%
from fiscal 2010 net sales, and earnings will increase to approximately $2.30 - $2.45 per diluted share. Sales,
earnings and margin improvements are expected in all three businesses in fiscal 2011. The Company expects
moderately higher automotive production in North America, with flat European production, versus fiscal 2010.
China automotive production is expected to increase in the coming year, though at a slower pace than in fiscal 2010.
The Company expects the global building efficiency market to improve in fiscal 2011 led by recovery in the
emerging markets, especially China and the Middle East, offsetting softness in mature geographic markets.
The Company expects building efficiency business net sales to be 8% - 10% higher in fiscal 2011 based on strong
backlog and order rate improvements entering the year. The Company expects higher demand in emerging markets
and global workplace solutions as well as in its energy efficiency and sustainability (greenhouse gas reduction)
offerings. A moderate recovery is anticipated for technical services in non-residential buildings. The Company’s
residential HVAC business is expected to increase at a double-digit pace for the second consecutive year. Segment
margins are expected to increase to 5.6% - 5.8% led by the growth in emerging markets and continued
improvements in the residential business. The higher margins will likely be partially offset by investments in growth
opportunities including an expansion in sales force and the establishment of dedicated energy solutions resources in
Europe and Asia.
The Company expects approximately 5% net sales growth in fiscal 2011 by its automotive experience business,
reflecting the impact of new seating and interiors program launches in addition to the slightly higher production
volumes. Segment margins are expected to improve to 4.5% - 4.7% in fiscal 2011 resulting from the Company's cost
improvement initiatives and improved level of profitability on new business awards, including in China where the
Company operates primarily through unconsolidated joint ventures.
Power solutions net sales are expected to increase 10% - 15% due to volume growth across all regions resulting
from market share gains and growth in emerging markets. Segment margins are expected to be 13.4% - 13.6%,
reflecting manufacturing process efficiencies, the benefits of vertical integration for the recycling of lead and the
expansion of local production capacity in China.
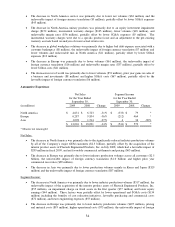
Segment Analysis
Management evaluates the performance of its business units based primarily on segment income, which is defined as
income from continuing operations before income taxes and noncontrolling interests excluding net financing
charges, debt conversion costs and restructuring costs.
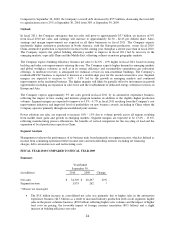
FISCAL YEAR 2010 COMPARED TO FISCAL YEAR 2009
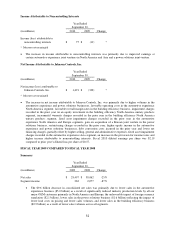
Summary
Year Ended
September 30,
(in millions)
2010
2009
Change
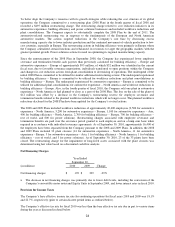
Net sales
$
34,305
$
28,497
20%
Segment income
1,933
262
*
* Measure not meaningful
The $5.8 billion increase in consolidated net sales was primarily due to higher sales in the automotive
experience business ($4.5 billion) as a result of increased industry production levels in all segments, higher
sales in the power solutions business ($0.8 billion) reflecting higher sales volumes and the impact of higher
lead costs on pricing, the favorable impact of foreign currency translation ($0.5 billion) and a slight
increase in building efficiency net sales.