Johnson Controls 2010 Annual Report Download - page 102
Download and view the complete annual report
Please find page 102 of the 2010 Johnson Controls annual report below. You can navigate through the pages in the report by either clicking on the pages listed below, or by using the keyword search tool below to find specific information within the annual report.-
 1
1 -
2
-
3
-
4
-
5
-
6
-
7
-
8
-
9
-
10
-
11
-
12
-
13
-
14
-
15
-
16
-
17
-
18
-
19
-
20
-
21
-
22
-
23
-
24
-
25
-
26
-
27
-
28
-
29
-
30
-
31
-
32
-
33
-
34
-
35
-
36
-
37
-
38
-
39
-
40
-
41
-
42
-
43
-
44
-
45
-
46
-
47
-
48
-
49
-
50
-
51
-
52
-
53
-
54
-
55
-
56
-
57
-
58
-
59
-
60
-
61
-
62
-
63
-
64
-
65
-
66
-
67
-
68
-
69
-
70
-
71
-
72
-
73
-
74
-
75
-
76
-
77
-
78
-
79
-
80
-
81
-
82
-
83
-
84
-
85
-
86
-
87
-
88
-
89
-
90
-
91
-
 92
92 -
 93
93 -
 94
94 -
 95
95 -
 96
96 -
 97
97 -
 98
98 -
 99
99 -
 100
100 -
 101
101 -
 102
102 -
 103
103 -
 104
104 -
 105
105 -
 106
106 -
 107
107 -
 108
108 -
 109
109 -
 110
110 -
 111
111 -
 112
112 -
113
-
114
 |
 |

102
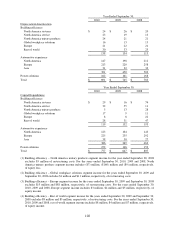
Year Ended September 30,
2010
2009
2008
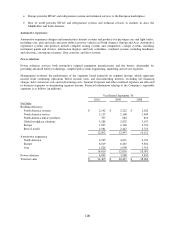
Depreciation/Amortization
Building efficiency
North America systems
$
24
$
26
$
20
North America service
23
19
13
North America unitary products
24
21
21
Global workplace solutions
16
13
13
Europe
21
22
21
Rest of world
30
33
25
138
134
113
Automotive experience
North America
147
198
212
Europe
213
220
258
Asia
31
32
32
391
450
502
Power solutions
162
161
168
Total
$
691
$
745
$
783
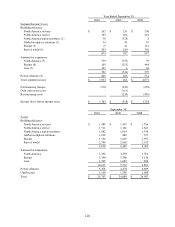
Year Ended September 30,
2010
2009
2008
Capital Expenditures
Building efficiency
North America systems
$
29
$
16
$
74
North America service
32
55
11
North America unitary products
5
13
28
Global workplace solutions
17
9
11
Europe
8
8
22
Rest of world
28
31
47
119
132
193
Automotive experience
North America
123
104
143
Europe
225
235
292
Asia
38
30
27
386
369
462
Power solutions
272
146
152
Total
$
777
$
647
$
807
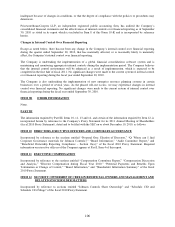
(1) Building efficiency – North America unitary products segment income for the year ended September 30, 2008
excludes $5 million of restructuring costs. For the years ended September 30, 2010, 2009 and 2008, North
America unitary products segment income includes ($7) million, ($160) million and ($9) million, respectively,
of equity loss.
(2) Building efficiency – Global workplace solutions segment income for the years ended September 30, 2009 and
September 30, 2008 excludes $1 million and $11 million, respectively, of restructuring costs.
(3) Building efficiency – Europe segment income for the years ended September 30, 2009 and September 30, 2008
excludes $15 million and $88 million, respectively, of restructuring costs. For the years ended September 30,
2010, 2009 and 2008, Europe segment income includes $3 million, $4 million and $5 million, respectively, of
equity income.
(4) Building efficiency – Rest of world segment income for the years ended September 30, 2009 and September 30,
2008 excludes $8 million and $5 million, respectively, of restructuring costs. For the years ended September 30,
2010, 2009 and 2008, rest of world segment income includes $8 million, $4 million and $7 million, respectively,
of equity income.