Johnson Controls 2010 Annual Report Download - page 34
Download and view the complete annual report
Please find page 34 of the 2010 Johnson Controls annual report below. You can navigate through the pages in the report by either clicking on the pages listed below, or by using the keyword search tool below to find specific information within the annual report.-
 1
1 -
2
-
3
-
4
-
5
-
6
-
7
-
8
-
9
-
10
-
11
-
12
-
13
-
14
-
15
-
16
-
17
-
18
-
19
-
20
-
21
-
22
-
23
-
 24
24 -
 25
25 -
 26
26 -
 27
27 -
 28
28 -
 29
29 -
 30
30 -
 31
31 -
 32
32 -
 33
33 -
 34
34 -
 35
35 -
 36
36 -
 37
37 -
 38
38 -
 39
39 -
 40
40 -
 41
41 -
 42
42 -
 43
43 -
 44
44 -
45
-
46
-
47
-
48
-
49
-
50
-
51
-
52
-
53
-
54
-
55
-
56
-
57
-
58
-
59
-
60
-
61
-
62
-
63
-
64
-
65
-
66
-
67
-
68
-
69
-
70
-
71
-
72
-
73
-
74
-
75
-
76
-
77
-
78
-
79
-
80
-
81
-
82
-
83
-
84
-
85
-
86
-
87
-
88
-
89
-
90
-
91
-
92
-
93
-
94
-
95
-
96
-
97
-
98
-
99
-
100
-
101
-
102
-
103
-
104
-
105
-
106
-
107
-
108
-
109
-
110
-
111
-
112
-
113
-
114
 |
 |

34
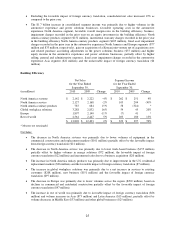
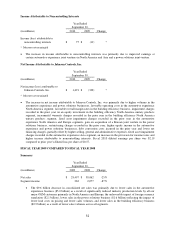
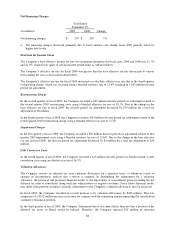
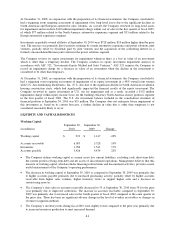
The decrease in North America service was primarily due to lower net volumes ($62 million) and the
unfavorable impact of foreign currency translation ($3 million), partially offset by lower SG&A expenses
($45 million).
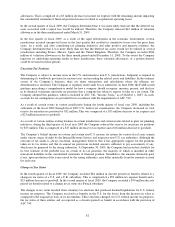
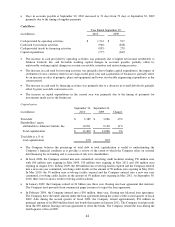
The decrease in North America unitary products was primarily due to an equity investment impairment
charge ($152 million), incremental warranty charges ($105 million), lower volumes ($18 million), and
unfavorable margin rates ($56 million), partially offset by lower SG&A expenses ($5 million). The
incremental warranty charges were due to a specific product issue and an adjustment to the pre-existing
warranty accruals based on analysis of recent actual return rates.
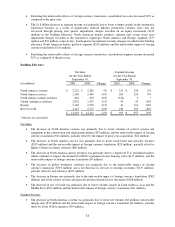
The decrease in global workplace solutions was primarily due to higher bad debt expense associated with a
customer bankruptcy ($8 million), the unfavorable impact of foreign currency translation ($7 million) and
lower volumes and unfavorable mix in North America ($11 million), partially offset by lower SG&A
expenses ($12 million).
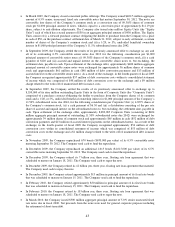
The decrease in Europe was primarily due to lower volumes ($61 million), the unfavorable impact of
foreign currency translation ($16 million) and unfavorable margin rates ($37 million), partially offset by
lower SG&A costs ($41 million).
The decrease in rest of world was primarily due to lower volumes ($53 million), prior year gains on sales of
a business and investments ($8 million) and higher SG&A costs ($67 million), partially offset by the
favorable impact of foreign currency translation ($6 million).
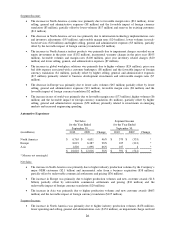
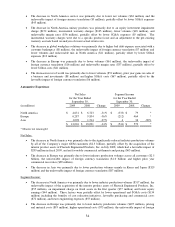
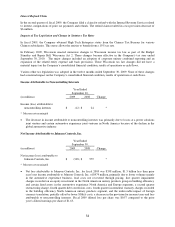
Automotive Experience
Net Sales
Segment Income
for the Year Ended
for the Year Ended
September 30,
September 30,
(in millions)
2009
2008
Change
2009
2008
Change
North America
$
4,631
$
6,723
-31%
$
(333)
$
79
*
Europe
6,287
9,854
-36%
(212)
464
*
Asia
1,098
1,514
-27%
4
36
-89%
$
12,016
$
18,091
-34%
$
(541)
$
579
*
* Measure not meaningful
Net Sales:
The decrease in North America was primarily due to the significantly reduced industry production volumes
by all of the Company’s major OEM customers ($2.5 billion), partially offset by the acquisition of the
interior product assets of Plastech Engineered Products, Inc. in July 2008, which had a favorable impact of
$299 million in fiscal 2009, and net favorable commercial settlements and pricing ($63 million).
The decrease in Europe was primarily due to lower industry production volumes across all customers ($2.5
billion), the unfavorable impact of foreign currency translation ($1.0 billion) and higher prior year
commercial recoveries ($89 million).
The decrease in Asia was primarily due to lower production volumes mainly in Korea and Japan ($329
million) and the unfavorable impact of foreign currency translation ($87 million).
Segment Income:
The decrease in North America was primarily due to lower industry production volumes ($517 million), the
unfavorable impact of the acquisition of the interior product assets of Plastech Engineered Products, Inc.
($55 million), an impairment charge on fixed assets in the first quarter ($77 million) and lower equity
earnings ($44 million). These factors were partially offset by lower operational and SG&A costs ($154
million) including the benefits of cost reduction initiatives, favorable purchasing and commercial costs
($72 million), and lower engineering expenses ($55 million).
The decrease in Europe was primarily due to lower industry production volumes ($497 million), pricing
and material costs ($93 million), higher operational costs ($73 million), the unfavorable impact of foreign