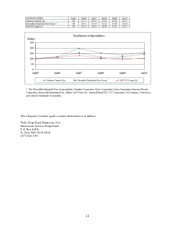
Johnson Controls 2010 Annual Report Download - page 27
Download and view the complete annual report
Please find page 27 of the 2010 Johnson Controls annual report below. You can navigate through the pages in the report by either clicking on the pages listed below, or by using the keyword search tool below to find specific information within the annual report.-
 1
1 -
2
-
3
-
4
-
5
-
6
-
7
-
8
-
9
-
10
-
11
-
12
-
13
-
14
-
15
-
16
-
 17
17 -
 18
18 -
 19
19 -
 20
20 -
 21
21 -
 22
22 -
 23
23 -
 24
24 -
 25
25 -
 26
26 -
 27
27 -
 28
28 -
 29
29 -
 30
30 -
 31
31 -
 32
32 -
 33
33 -
 34
34 -
 35
35 -
 36
36 -
 37
37 -
38
-
39
-
40
-
41
-
42
-
43
-
44
-
45
-
46
-
47
-
48
-
49
-
50
-
51
-
52
-
53
-
54
-
55
-
56
-
57
-
58
-
59
-
60
-
61
-
62
-
63
-
64
-
65
-
66
-
67
-
68
-
69
-
70
-
71
-
72
-
73
-
74
-
75
-
76
-
77
-
78
-
79
-
80
-
81
-
82
-
83
-
84
-
85
-
86
-
87
-
88
-
89
-
90
-
91
-
92
-
93
-
94
-
95
-
96
-
97
-
98
-
99
-
100
-
101
-
102
-
103
-
104
-
105
-
106
-
107
-
108
-
109
-
110
-
111
-
112
-
113
-
114
 |
 |

27
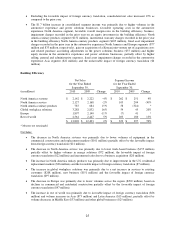
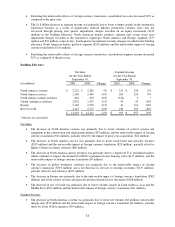
assets recorded in the prior year ($77 million) and higher equity income ($28 million), partially offset by
higher engineering expenses ($22 million).
The increase in Europe was primarily due to higher production volumes ($350 million), favorable
purchasing costs ($64 million), an impairment charge on fixed assets recorded in the prior year ($33
million), higher equity income ($10 million) and favorable operating costs ($8 million), partially offset by
higher prior year commercial recoveries ($45 million), higher engineering expenses ($44 million), higher
selling, general and administrative costs ($39 million) and the unfavorable impact of foreign currency
translation ($19 million).
The increase in Asia was primarily due to higher production volumes ($90 million), higher equity income
at our joint ventures mainly in China ($62 million) and the favorable impact of foreign currency translation
($1 million), partially offset by asset impairment charges in Japan ($22 million), higher engineering
expenses ($10 million) and higher selling, general and administrative costs ($17 million).
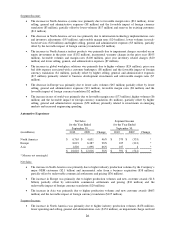
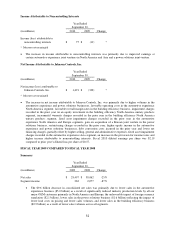
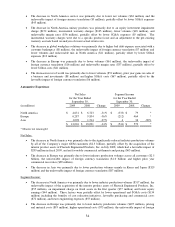
Power Solutions
Year Ended
September 30,
(in millions)
2010
2009
Change
Net sales
$
4,893
$
3,988
23%
Segment income
669
406
65%
Net sales increased primarily due to higher sales volumes ($454 million), the impact of higher lead costs on
pricing ($316 million), the favorable impact of foreign currency translation ($69 million), incremental sales
due to a business acquisition ($43 million) and favorable price/product mix ($23 million).
Segment income increased primarily due to higher sales volumes ($164 million), gain on acquisition of a
Korean joint venture net of acquisition costs and related purchase accounting adjustments ($37 million) as
discussed in Note 2, ―Acquisitions,‖ to the accompanying financial statements, higher equity income ($27
million), prior year disposal of a former manufacturing facility in Europe and other assets ($20 million), the
favorable impact of foreign currency translation ($3 million) and favorable net lead and other commodity
costs and pricing ($56 million), which includes a prior year $62 million out of period adjustment as
discussed in Note 1, ―Summary of Significant Accounting Policies,‖ to the accompanying financial
statements. Partially offsetting these factors were higher selling, general and administrative costs ($46
million).
Restructuring Costs
To better align the Company’s cost structure with global automotive market conditions, the Company committed to
a restructuring plan (2009 Plan) in the second quarter of fiscal 2009 and recorded a $230 million restructuring
charge. The restructuring charge related to cost reduction initiatives in the Company’s automotive experience,
building efficiency and power solutions businesses and included workforce reductions and plant consolidations. The
Company expects to substantially complete the 2009 Plan by the end of 2011. The automotive-related restructuring
actions targeted excess manufacturing capacity resulting from lower industry production in the European, North
American and Japanese automotive markets. The restructuring actions in building efficiency were primarily in
Europe where the Company is centralizing certain functions and rebalancing its resources to target the geographic
markets with the greatest potential growth. Power solutions actions focused on optimizing its manufacturing
capacity as a result of lower overall demand for original equipment batteries resulting from lower vehicle
production levels.
Since the announcement of the 2009 Plan in March 2009, the Company has experienced lower employee severance
and termination benefit cash payouts than previously calculated for automotive experience – Europe of
approximately $70 million, of which $42 million was identified in the current fiscal year, due to favorable severance
negotiations and the decision to not close previously planned plants in response to increased customer demand. The
underspend of the initial 2009 Plan reserves is committed to be utilized for additional costs to be incurred as part of
power solutions, automotive experience - Europe and automotive experience - North America’s additional cost
reduction initiatives. The planned workforce reductions disclosed for the 2009 Plan have been updated for the
Company’s revised actions.