HSBC 2001 Annual Report Download - page 68
Download and view the complete annual report
Please find page 68 of the 2001 HSBC annual report below. You can navigate through the pages in the report by either clicking on the pages listed below, or by using the keyword search tool below to find specific information within the annual report.-
 1
1 -
2
-
3
-
4
-
5
-
6
-
7
-
8
-
9
-
10
-
11
-
12
-
13
-
14
-
15
-
16
-
17
-
18
-
19
-
20
-
21
-
22
-
23
-
24
-
25
-
26
-
27
-
28
-
29
-
30
-
31
-
32
-
33
-
34
-
35
-
36
-
37
-
38
-
39
-
40
-
41
-
42
-
43
-
44
-
45
-
46
-
47
-
48
-
49
-
50
-
51
-
52
-
53
-
54
-
55
-
56
-
57
-
 58
58 -
 59
59 -
 60
60 -
 61
61 -
 62
62 -
 63
63 -
 64
64 -
 65
65 -
 66
66 -
 67
67 -
 68
68 -
 69
69 -
 70
70 -
 71
71 -
 72
72 -
 73
73 -
 74
74 -
 75
75 -
 76
76 -
 77
77 -
 78
78 -
79
-
80
-
81
-
82
-
83
-
84
-
85
-
86
-
87
-
88
-
89
-
90
-
91
-
92
-
93
-
94
-
95
-
96
-
97
-
98
-
99
-
100
-
101
-
102
-
103
-
104
-
105
-
106
-
107
-
108
-
109
-
110
-
111
-
112
-
113
-
114
-
115
-
116
-
117
-
118
-
119
-
120
-
121
-
122
-
123
-
124
-
125
-
126
-
127
-
128
-
129
-
130
-
131
-
132
-
133
-
134
-
135
-
136
-
137
-
138
-
139
-
140
-
141
-
142
-
143
-
144
-
145
-
146
-
147
-
148
-
149
-
150
-
151
-
152
-
153
-
154
-
155
-
156
-
157
-
158
-
159
-
160
-
161
-
162
-
163
-
164
-
165
-
166
-
167
-
168
-
169
-
170
-
171
-
172
-
173
-
174
-
175
-
176
-
177
-
178
-
179
-
180
-
181
-
182
-
183
-
184
-
185
-
186
-
187
-
188
-
189
-
190
-
191
-
192
-
193
-
194
-
195
-
196
-
197
-
198
-
199
-
200
-
201
-
202
-
203
-
204
-
205
-
206
-
207
-
208
-
209
-
210
-
211
-
212
-
213
-
214
-
215
-
216
-
217
-
218
-
219
-
220
-
221
-
222
-
223
-
224
-
225
-
226
-
227
-
228
-
229
-
230
-
231
-
232
-
233
-
234
-
235
-
236
-
237
-
238
-
239
-
240
-
241
-
242
-
243
-
244
-
245
-
246
-
247
-
248
-
249
-
250
-
251
-
252
-
253
-
254
-
255
-
256
-
257
-
258
-
259
-
260
-
261
-
262
-
263
-
264
-
265
-
266
-
267
-
268
-
269
-
270
-
271
-
272
-
273
-
274
-
275
-
276
-
277
-
278
-
279
-
280
-
281
-
282
-
283
-
284
 |
 |

HSBC HOLDINGS PLC
Financial Review (continued)
66
2000), was US$16 million lower than in 2000 as a 13
per cent increase in personal and commercial
services revenues only partly offset lower levels of
broking and capital market fees in weaker equity
stock markets.
As part of its strategy of providing customers
with multiple choices for product and service
delivery, HSBC Bank USA now offers a
comprehensive Internet Banking service. At 31
December 2001, more than 275,000 customers had
registered for the service, up from approximately
80,000 at year-end 2000. The HSBC Bank USA web
site, us.hsbc.com, where customers can apply for
accounts, conduct financial planning and link to
online services, receives over 37,000 visits daily.
During 2001, HSBC’s second generation
strategic internet banking platform being developed
in the United States hsbc.com launched its first
business applications. The hsbc.com program has
been designed to maximise the ability to offer any or
all of our services to any or all of our customers.
hsbc.com provides a common presentation and
browser capability. By adopting this approach, we
enhance the choices our customers have in selecting
how they want to do business with us, while
reducing our cost of providing the services. All the
key systems, which provide our core services, are
planning on integrating with hsbc.com over the next
five years.
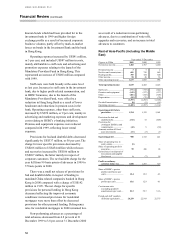
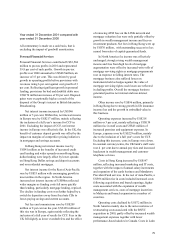
Operating expenses, excluding goodwill
amortisation, of US$2,488 million in 2001 were
US$125 million, or 5 per cent higher than for 2000.
Of this increase, US$164 million related to
development costs associated with hsbc.com.
Excluding these costs and adjusting for the transfer
of HSBC InvestDirect (Canada) Inc, underlying costs
were US$29 million, or 1 per cent, lower than in
2000. HSBC Markets USA’ s operating expenses
increased by US$58 million all of which related to
higher staff costs reflecting higher levels of
performance-related bonuses on improved trading
revenues together with additional headcount building
on the successful trading platform in place.
Operating expenses in the domestic operations of
HSBC Bank USA were 2 per cent lower compared to
2000. A reduced level of acquisition related
restructuring charges in 2001 was offset by business
expansion in treasury, wealth management and e-
commerce, and increased marketing expenses.
Higher depreciation expense resulting from
infrastructure improvements represents a delayed
restructuring charge. In Canada, excluding HSBC
Invest Direct Inc’s costs in 2000, operating expenses
were US$29 million lower, or 6 per cent, of which
US$24 million related to lower staff costs mainly
lower performance related bonuses as a result of
lower levels of trading revenues in the scaled back
equity operations. Lower volumes of transaction-
driven costs and continuing efforts to improve
operational efficiencies reduced other operating
expenses by US$5 million.
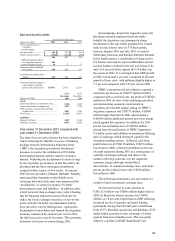
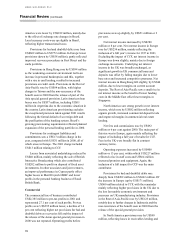
Credit quality deteriorated modestly during
2001. In the United States new specific provisions of
US$313 million, were US$25 million lower than in
2000 and took into account requirements against an
exposure to a corporate customer in the energy
sector. An increase in new specific provisions in
Canada of US$40 million related to the deterioration
of a small number of commercial facilities, notably
in the telecommunications sector. Releases and
recoveries were consistent with 2000 and the net
increase in the bad and doubtful debt charge of
US$140 million reflects the release of general
provision in the United States in 2000 not repeated in
2001.
In terms of non-performing loans overall credit
quality remained stable in 2001 with non-performing
loans at 31 December 2001 at US$627 million
compared with US$643 million at 31 December
2000. It is, however, still too early to determine the
medium to longer-term effect that the events of 11
September, the impact on market liquidity of the
Enron collapse and the general economic slowdown
may have on the overall credit portfolio.
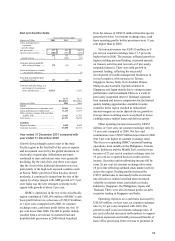
Gains on disposal of investments amounted to
US$129 million, an increase of US$94 million
compared with 2000. During the year, but
substantially in the first half, HSBC’s operations in
the United States sold mortgage-backed securities to
reduce exposure to refinancing mortgages in a
declining interest rate environment.
Year ended 31 December 2000 compared with
year ended 31 December 1999
Economic growth in the United States in 2000 was
strong at 5 per cent with inflation at 3.4 per cent. In
New York State, where the majority of HSBC’ s
business is done, personal incomes grew 4.8 per cent
in the first three quarters of 2000, compared to 6.7
per cent for the national economy.