HSBC 2001 Annual Report Download - page 269
Download and view the complete annual report
Please find page 269 of the 2001 HSBC annual report below. You can navigate through the pages in the report by either clicking on the pages listed below, or by using the keyword search tool below to find specific information within the annual report.-
 1
1 -
2
-
3
-
4
-
5
-
6
-
7
-
8
-
9
-
10
-
11
-
12
-
13
-
14
-
15
-
16
-
17
-
18
-
19
-
20
-
21
-
22
-
23
-
24
-
25
-
26
-
27
-
28
-
29
-
30
-
31
-
32
-
33
-
34
-
35
-
36
-
37
-
38
-
39
-
40
-
41
-
42
-
43
-
44
-
45
-
46
-
47
-
48
-
49
-
50
-
51
-
52
-
53
-
54
-
55
-
56
-
57
-
58
-
59
-
60
-
61
-
62
-
63
-
64
-
65
-
66
-
67
-
68
-
69
-
70
-
71
-
72
-
73
-
74
-
75
-
76
-
77
-
78
-
79
-
80
-
81
-
82
-
83
-
84
-
85
-
86
-
87
-
88
-
89
-
90
-
91
-
92
-
93
-
94
-
95
-
96
-
97
-
98
-
99
-
100
-
101
-
102
-
103
-
104
-
105
-
106
-
107
-
108
-
109
-
110
-
111
-
112
-
113
-
114
-
115
-
116
-
117
-
118
-
119
-
120
-
121
-
122
-
123
-
124
-
125
-
126
-
127
-
128
-
129
-
130
-
131
-
132
-
133
-
134
-
135
-
136
-
137
-
138
-
139
-
140
-
141
-
142
-
143
-
144
-
145
-
146
-
147
-
148
-
149
-
150
-
151
-
152
-
153
-
154
-
155
-
156
-
157
-
158
-
159
-
160
-
161
-
162
-
163
-
164
-
165
-
166
-
167
-
168
-
169
-
170
-
171
-
172
-
173
-
174
-
175
-
176
-
177
-
178
-
179
-
180
-
181
-
182
-
183
-
184
-
185
-
186
-
187
-
188
-
189
-
190
-
191
-
192
-
193
-
194
-
195
-
196
-
197
-
198
-
199
-
200
-
201
-
202
-
203
-
204
-
205
-
206
-
207
-
208
-
209
-
210
-
211
-
212
-
213
-
214
-
215
-
216
-
217
-
218
-
219
-
220
-
221
-
222
-
223
-
224
-
225
-
226
-
227
-
228
-
229
-
230
-
231
-
232
-
233
-
234
-
235
-
236
-
237
-
238
-
239
-
240
-
241
-
242
-
243
-
244
-
245
-
246
-
247
-
248
-
249
-
250
-
251
-
252
-
253
-
254
-
255
-
256
-
257
-
258
-
 259
259 -
 260
260 -
 261
261 -
 262
262 -
 263
263 -
 264
264 -
 265
265 -
 266
266 -
 267
267 -
 268
268 -
 269
269 -
 270
270 -
 271
271 -
 272
272 -
 273
273 -
 274
274 -
 275
275 -
 276
276 -
 277
277 -
 278
278 -
 279
279 -
280
-
281
-
282
-
283
-
284
 |
 |

267
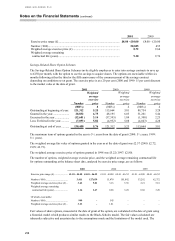
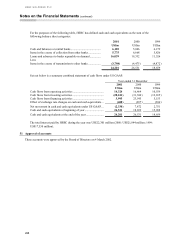
(l) Earnings per share
Basic earnings per share under US GAAP, SFAS 128 ‘Earnings per share’ , is calculated by dividing net income
of US$4,911 million (2000: US$6,236 million; 1999: US$4,889 million) by the weighted average number of
ordinary shares in issue in 2001 of 9,237 million (2000: 8,777 million; 1999: 8,296 million).
Diluted earnings per share under US GAAP is calculated by dividing net income, which requires no adjustment
for the effects of dilutive ordinary potential shares, by the weighted average number of shares outstanding plus
the weighted average number of ordinary shares that would be issued on conversion of all the dilutive potential
ordinary shares in 2001 of 9,336 million (2000: 8,865 million; 1999: 8,374 million), as shown in Note 11.
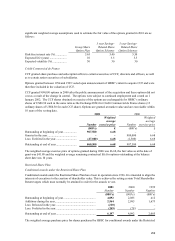
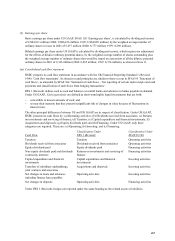
(m) Consolidated cash flow statement
HSBC prepares its cash flow statement in accordance with the UK Financial Reporting Standard 1 (Revised
1996) ‘Cash flow statements’ . Its objectives and principles are similar to those set out in SFAS 95 ‘Statement of
cash flows’ , as amended by SFAS 104 ‘Statement of cash flows – Net reporting of certain cash receipts and cash
payments and classification of cash flows from hedging transactions’ .
FRS 1 (Revised) defines cash as cash and balances at central banks and advances to banks payable on demand.
Under US GAAP, Cash equivalents are defined as short-term highly liquid investments that are both:
− convertible to known amounts of cash; and
− so near their maturity that they present insignificant risk of changes in value because of fluctuations in
interest rates.
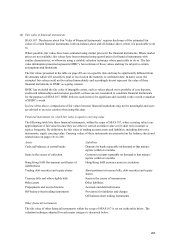
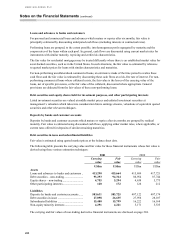
The other principal differences between US and UK GAAP are in respect of classification. Under UK GAAP,
HSBC presents its cash flows by: (a) Operating activities; (b) Dividends received from associates; (c) Returns
on investments and servicing of finance; (d) Taxation; (e) Capital expenditure and financial investments; (f)
Acquisitions and disposals; (g) Equity dividends paid; and (h) Financing. Under US GAAP, only three
categories are required. These are: (a) Operating; (b) Investing; and (c) Financing.
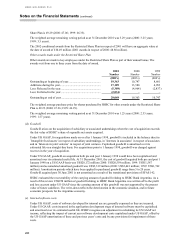
Classification Under Classification Under
Cash Flow FRS 1 (Revised) SFAS 95/104
Taxation Taxation Operating activities
Dividends received from associates Dividends received from associates Operating activities
Equity dividends paid Equity dividends paid Financing activities
Non-equity dividends paid and dividends
to minority interests
Returns on investments and servicing of
finance
Financing activities
Capital expenditure and financial
investments
Capital expenditure and financial
investments
Investing activities
Transfers of subsidiary undertakings,
joint ventures and associates
Acquisitions and disposals Investing activities
Net changes in loans and advances
including finance lease payables
Operating activities Investing activities
Net changes in deposits Operating activities Financing activities
Under FRS 1 (Revised), hedges are reported under the same heading as the related assets or liabilities.