HSBC 2001 Annual Report Download - page 57
Download and view the complete annual report
Please find page 57 of the 2001 HSBC annual report below. You can navigate through the pages in the report by either clicking on the pages listed below, or by using the keyword search tool below to find specific information within the annual report.-
 1
1 -
2
-
3
-
4
-
5
-
6
-
7
-
8
-
9
-
10
-
11
-
12
-
13
-
14
-
15
-
16
-
17
-
18
-
19
-
20
-
21
-
22
-
23
-
24
-
25
-
26
-
27
-
28
-
29
-
30
-
31
-
32
-
33
-
34
-
35
-
36
-
37
-
38
-
39
-
40
-
41
-
42
-
43
-
44
-
45
-
46
-
 47
47 -
 48
48 -
 49
49 -
 50
50 -
 51
51 -
 52
52 -
 53
53 -
 54
54 -
 55
55 -
 56
56 -
 57
57 -
 58
58 -
 59
59 -
 60
60 -
 61
61 -
 62
62 -
 63
63 -
 64
64 -
 65
65 -
 66
66 -
 67
67 -
68
-
69
-
70
-
71
-
72
-
73
-
74
-
75
-
76
-
77
-
78
-
79
-
80
-
81
-
82
-
83
-
84
-
85
-
86
-
87
-
88
-
89
-
90
-
91
-
92
-
93
-
94
-
95
-
96
-
97
-
98
-
99
-
100
-
101
-
102
-
103
-
104
-
105
-
106
-
107
-
108
-
109
-
110
-
111
-
112
-
113
-
114
-
115
-
116
-
117
-
118
-
119
-
120
-
121
-
122
-
123
-
124
-
125
-
126
-
127
-
128
-
129
-
130
-
131
-
132
-
133
-
134
-
135
-
136
-
137
-
138
-
139
-
140
-
141
-
142
-
143
-
144
-
145
-
146
-
147
-
148
-
149
-
150
-
151
-
152
-
153
-
154
-
155
-
156
-
157
-
158
-
159
-
160
-
161
-
162
-
163
-
164
-
165
-
166
-
167
-
168
-
169
-
170
-
171
-
172
-
173
-
174
-
175
-
176
-
177
-
178
-
179
-
180
-
181
-
182
-
183
-
184
-
185
-
186
-
187
-
188
-
189
-
190
-
191
-
192
-
193
-
194
-
195
-
196
-
197
-
198
-
199
-
200
-
201
-
202
-
203
-
204
-
205
-
206
-
207
-
208
-
209
-
210
-
211
-
212
-
213
-
214
-
215
-
216
-
217
-
218
-
219
-
220
-
221
-
222
-
223
-
224
-
225
-
226
-
227
-
228
-
229
-
230
-
231
-
232
-
233
-
234
-
235
-
236
-
237
-
238
-
239
-
240
-
241
-
242
-
243
-
244
-
245
-
246
-
247
-
248
-
249
-
250
-
251
-
252
-
253
-
254
-
255
-
256
-
257
-
258
-
259
-
260
-
261
-
262
-
263
-
264
-
265
-
266
-
267
-
268
-
269
-
270
-
271
-
272
-
273
-
274
-
275
-
276
-
277
-
278
-
279
-
280
-
281
-
282
-
283
-
284
 |
 |

55
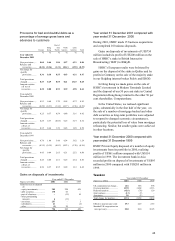
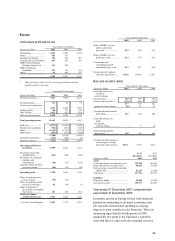
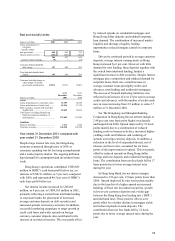
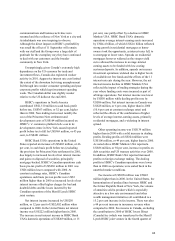
Bad and doubtful debts
Year ended 31 December
Figures in US$m 2001 2000 1999
Loans and advances to
customers
– specific charge
new provisions ..................... 449 454 720
releases and recoveries ......... (243 ) (207) (101)
206 247 619
–
general (release)/charge ..... (9) 1 (34)
Customer bad and doubtful
debt charge ...................... 197 248 585
Total bad and doubtful debt
charge .............................. 197 248 585
Customer bad debt charge as
a percentage of closing
gross loans and advances . 0.29% 0.37% 0.90%
Figures in US$m
At 31
December
2001
At 31
Decembe
r
2000
Assets
Loans and advances to customers (net)... 67,359 64,369
Loans and advances to banks (net) ......... 42,516 57,154
Debt securities, treasury bills and other
eligible bills ...................................... 49,625 38,913
Total assets (excluding Hong Kong
SAR Government certificates of
indebtedness)..................................... 175,652 176,545
Liabilities
Deposits by banks................................... 3,271 2,220
Customer accounts ................................. 146,544 146,394
Year ended 31 December 2001 compared with
year ended 31 December 2000
Despite large interest rate cuts, the Hong Kong
economy contracted through most of 2001 as
consumer spending was hit by rising unemployment
and a weak property market. The ongoing deflation
kept demand for consumption and investment loans
weak.
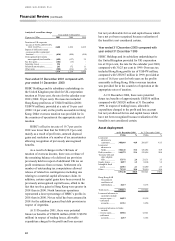
Hong Kong’s operations contributed US$3,883
million to HSBC’s cash basis profit before tax, an
increase of US$191 million, or 5 per cent, compared
with 2000, and represented 48.5 per cent of HSBC’s
cash basis profit before tax.
Net interest income increased by US$168
million, or 4 per cent, to US$4,165 million in 2001,
primarily reflecting a switch from interbank lending
to corporate bonds, the placement of increased
average customer deposits in debt securities and
increased spreads on treasury activities. In addition,
successful marketing campaigns to target growth in
credit card loans and wider spreads on foreign
currency customer deposits also contributed to the
increase in net interest income. This was partly offset
by reduced spreads on residential mortgages and
Hong Kong dollar deposits and subdued corporate
loan demand. The combination of increased market
liquidity and shortage of quality lending
opportunities reduced margins earned on corporate
loans.
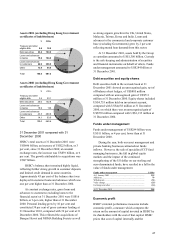
Driven by continued growth in average customer
deposits, average interest-earning assets in Hong
Kong increased by 6 per cent. However with little
demand for new lending, these deposits together with
the switch from interbank lending, funded a
significant increase in debt securities. Despite intense
mortgage price competition and subdued demand for
corporate loans, there was a small increase in
average customer loans principally credit card
advances, term lending and residential mortgages.
The success of focused marketing initiatives was
reflected in an increase of over 23 per cent in average
credit card advances, with the number of credit cards
now in issue increasing from 2.5 million to some 2.7
million at 31 December 2001.
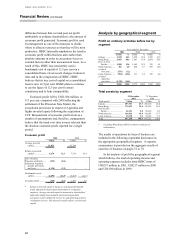
For The Hongkong and Shanghai Banking
Corporation in Hong Kong the net interest margin at
2.48 per cent (one basis point higher) was largely
unchanged from 2000. Spread improved by 18 basis
points mainly due to a combination of reduced
funding costs on treasury activities, increased higher-
yielding credit card balances and widening of
spreads on foreign currency deposits. In addition, a
reduction in the level of suspended interest, net of
releases and recoveries, accounted for six basis
points of the improvement in spread. This was partly
offset by reduced spreads on Hong Kong dollar
savings and time deposits and residential mortgage
loans. The contribution from net free funds fell by 17
basis points due to lower average interest rates
during the year.
In Hang Seng Bank, the net interest margin
decreased to 2.56 per cent, 12 basis points lower than
2000. Spread improved by nine basis points mainly
due to the benefits of a higher spread on increased
holdings of fixed rate investment securities, growth
in lower-cost customer deposits and a wider gap
between the Hong Kong best lending rate (‘BLR’ )
and interbank rates. These positive effects were
partly offset by a further decline in mortgage yields
and reduced spreads on term deposits. The
contribution from net free funds fell by 21 basis
points due to lower average interest rates during the
year.