HSBC 2001 Annual Report Download - page 56
Download and view the complete annual report
Please find page 56 of the 2001 HSBC annual report below. You can navigate through the pages in the report by either clicking on the pages listed below, or by using the keyword search tool below to find specific information within the annual report.-
 1
1 -
2
-
3
-
4
-
5
-
6
-
7
-
8
-
9
-
10
-
11
-
12
-
13
-
14
-
15
-
16
-
17
-
18
-
19
-
20
-
21
-
22
-
23
-
24
-
25
-
26
-
27
-
28
-
29
-
30
-
31
-
32
-
33
-
34
-
35
-
36
-
37
-
38
-
39
-
40
-
41
-
42
-
43
-
44
-
45
-
 46
46 -
 47
47 -
 48
48 -
 49
49 -
 50
50 -
 51
51 -
 52
52 -
 53
53 -
 54
54 -
 55
55 -
 56
56 -
 57
57 -
 58
58 -
 59
59 -
 60
60 -
 61
61 -
 62
62 -
 63
63 -
 64
64 -
 65
65 -
 66
66 -
67
-
68
-
69
-
70
-
71
-
72
-
73
-
74
-
75
-
76
-
77
-
78
-
79
-
80
-
81
-
82
-
83
-
84
-
85
-
86
-
87
-
88
-
89
-
90
-
91
-
92
-
93
-
94
-
95
-
96
-
97
-
98
-
99
-
100
-
101
-
102
-
103
-
104
-
105
-
106
-
107
-
108
-
109
-
110
-
111
-
112
-
113
-
114
-
115
-
116
-
117
-
118
-
119
-
120
-
121
-
122
-
123
-
124
-
125
-
126
-
127
-
128
-
129
-
130
-
131
-
132
-
133
-
134
-
135
-
136
-
137
-
138
-
139
-
140
-
141
-
142
-
143
-
144
-
145
-
146
-
147
-
148
-
149
-
150
-
151
-
152
-
153
-
154
-
155
-
156
-
157
-
158
-
159
-
160
-
161
-
162
-
163
-
164
-
165
-
166
-
167
-
168
-
169
-
170
-
171
-
172
-
173
-
174
-
175
-
176
-
177
-
178
-
179
-
180
-
181
-
182
-
183
-
184
-
185
-
186
-
187
-
188
-
189
-
190
-
191
-
192
-
193
-
194
-
195
-
196
-
197
-
198
-
199
-
200
-
201
-
202
-
203
-
204
-
205
-
206
-
207
-
208
-
209
-
210
-
211
-
212
-
213
-
214
-
215
-
216
-
217
-
218
-
219
-
220
-
221
-
222
-
223
-
224
-
225
-
226
-
227
-
228
-
229
-
230
-
231
-
232
-
233
-
234
-
235
-
236
-
237
-
238
-
239
-
240
-
241
-
242
-
243
-
244
-
245
-
246
-
247
-
248
-
249
-
250
-
251
-
252
-
253
-
254
-
255
-
256
-
257
-
258
-
259
-
260
-
261
-
262
-
263
-
264
-
265
-
266
-
267
-
268
-
269
-
270
-
271
-
272
-
273
-
274
-
275
-
276
-
277
-
278
-
279
-
280
-
281
-
282
-
283
-
284
 |
 |

HSBC HOLDINGS PLC
Financial Review (continued)
54
particularly in relation to new delivery channels. As a
result of business growth, HSBC Bank plc employed
3 per cent more staff on average during 2000. Non-
staff costs increased by US$130 million, or 9 per
cent. They were incurred primarily to support
business development, including internet banking
initiatives and continued branch services
improvement. Increased business volumes also
contributed to higher expenditure, including IT
processing capacity. Increased marketing costs
included higher card loyalty scheme costs.
Operating expenses also increased in Investment
Banking, where profit-related remuneration reflected
the improved performance, and in Offshore Banking,
which reflected increased staff numbers in support of
expansion. These increases were partly offset by a
US$255 million, or 5 per cent, reduction in Treasury
and Capital Markets due to improved operating
efficiencies in the front and back offices.
The charge for bad and doubtful debts was
US$62 million lower than 1999 at US$348 million.
In UK Banking, the charge for bad and doubtful
debts was US$397 million, US$73 million, or 16 per
cent, lower than in 1999. There was a reduction of
US$129 million in new provisions, with lower
provisioning against corporate lending, mainly due to
a small number of large provisions in 1999.
Provisions were also lower against card balances and
in First Direct. General provisions increased by
US$42 million due to balance sheet growth. The
credit environment remains satisfactory, but a small
number of business and personal customers continue
to face difficulties from market pressures and
unforeseen changes in financial circumstances.
Provisions for contingent liabilities were US$37
million lower at US$67 million partly due to a lower
charge in UK Banking for the amount of redress
potentially payable to customers who may have been
disadvantaged when transferring from or opting out
of occupational pensions schemes.
The US$47 million share of operating losses in
joint ventures principally reflects start-up costs of the
new joint venture with Merrill Lynch to establish an
online, investment led, broking and banking service
for the mass affluent.
The net US$49 million share of operating losses
in associated undertakings include losses of US$76
million reflecting HSBC Bank plc’s 20 per cent
shareholding in British Interactive Broadcasting
(‘BiB’ ) and the associated investment in building its
digital interactive television services, ‘Open....’ . In
July 2000, HSBC Bank plc agreed to sell its
investment in BiB to BSkyB.
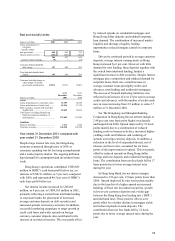
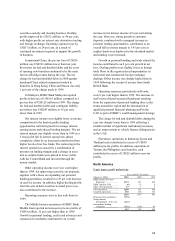
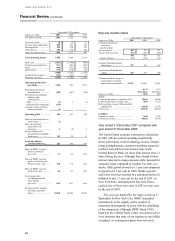
Hong Kong
Year ended 31 December
Figures in US$m 2001 2000 1999
Net interest income............... 4,165 3,997 3,735
Dividend income .................. 26 34 39
Net fees and commissions..... 1,172 1,168 964
Dealing profits...................... 218 229 211
Other income ........................ 436 359 338
Other operating income ........ 1,852 1,790 1,552
Total operating income....... 6,017 5,787 5,287
Staff costs............................. (1,279 ) (1,166) (1,145)
Premises and equipmen
t
....... (234) (218) (262 )
Othe
r
.................................... (428) (412) (299 )
Depreciatio
n
......................... (199) (190) (190 )
(2,140) (1,986 ) (1,896)
Goodwill amortisatio
n
..........
–
(1)
–
Operating expenses............... (2,140) (1,987 ) (1,896)
Operating profit before
provisions........................ 3,877 3,800 3,391
Provisions for bad and
doubtful debts .................. (197 ) (248) (585)
Provisions for
contingent liabilities and
commitments ................... 6(10) 2
Amounts written off fixed
asset investments ............. (18 ) (9 ) (5)
Operating profit.................. 3,668 3,533 2,803
Share of operating profit in
associated undertakings.... 17 21 15
Gains on disposal of
investments and tangible
fixed assets ...................... 198 137 236
Profit on ordinary
activities before ta
x
........ 3,883 3,691 3,054
Share of HSBC’ s pre-tax
profits (cash basis)
(per cent).......................... 44.1 35.9 38.1
Share of HSBC’ s pre-tax
p
rofits (per cent) .............. 48.5 37.8 38.3
Cost:income ratio
(excluding goodwill
amortisation)
(per cent).......................... 35.6 34.3 35.9
Period-end staff numbers
(full-time equivalent) ....... 24,654 24,204 23,932