HSBC 2001 Annual Report Download - page 260
Download and view the complete annual report
Please find page 260 of the 2001 HSBC annual report below. You can navigate through the pages in the report by either clicking on the pages listed below, or by using the keyword search tool below to find specific information within the annual report.-
 1
1 -
2
-
3
-
4
-
5
-
6
-
7
-
8
-
9
-
10
-
11
-
12
-
13
-
14
-
15
-
16
-
17
-
18
-
19
-
20
-
21
-
22
-
23
-
24
-
25
-
26
-
27
-
28
-
29
-
30
-
31
-
32
-
33
-
34
-
35
-
36
-
37
-
38
-
39
-
40
-
41
-
42
-
43
-
44
-
45
-
46
-
47
-
48
-
49
-
50
-
51
-
52
-
53
-
54
-
55
-
56
-
57
-
58
-
59
-
60
-
61
-
62
-
63
-
64
-
65
-
66
-
67
-
68
-
69
-
70
-
71
-
72
-
73
-
74
-
75
-
76
-
77
-
78
-
79
-
80
-
81
-
82
-
83
-
84
-
85
-
86
-
87
-
88
-
89
-
90
-
91
-
92
-
93
-
94
-
95
-
96
-
97
-
98
-
99
-
100
-
101
-
102
-
103
-
104
-
105
-
106
-
107
-
108
-
109
-
110
-
111
-
112
-
113
-
114
-
115
-
116
-
117
-
118
-
119
-
120
-
121
-
122
-
123
-
124
-
125
-
126
-
127
-
128
-
129
-
130
-
131
-
132
-
133
-
134
-
135
-
136
-
137
-
138
-
139
-
140
-
141
-
142
-
143
-
144
-
145
-
146
-
147
-
148
-
149
-
150
-
151
-
152
-
153
-
154
-
155
-
156
-
157
-
158
-
159
-
160
-
161
-
162
-
163
-
164
-
165
-
166
-
167
-
168
-
169
-
170
-
171
-
172
-
173
-
174
-
175
-
176
-
177
-
178
-
179
-
180
-
181
-
182
-
183
-
184
-
185
-
186
-
187
-
188
-
189
-
190
-
191
-
192
-
193
-
194
-
195
-
196
-
197
-
198
-
199
-
200
-
201
-
202
-
203
-
204
-
205
-
206
-
207
-
208
-
209
-
210
-
211
-
212
-
213
-
214
-
215
-
216
-
217
-
218
-
219
-
220
-
221
-
222
-
223
-
224
-
225
-
226
-
227
-
228
-
229
-
230
-
231
-
232
-
233
-
234
-
235
-
236
-
237
-
238
-
239
-
240
-
241
-
242
-
243
-
244
-
245
-
246
-
247
-
248
-
249
-
 250
250 -
 251
251 -
 252
252 -
 253
253 -
 254
254 -
 255
255 -
 256
256 -
 257
257 -
 258
258 -
 259
259 -
 260
260 -
 261
261 -
 262
262 -
 263
263 -
 264
264 -
 265
265 -
 266
266 -
 267
267 -
 268
268 -
 269
269 -
 270
270 -
271
-
272
-
273
-
274
-
275
-
276
-
277
-
278
-
279
-
280
-
281
-
282
-
283
-
284
 |
 |

HSBC HOLDINGS PLC
Notes on the Financial Statements (continued)
258
2001 2000
Exercise
p
rice ran
g
e
(
£
)
.................................................................................... £8.00 - £10.00 £8.00 - £10.00
N
umber
(
‘000
)
.................................................................................................. 50
,
825 455
Weighted average exercise price (£) ................................................................ 8.72 9.64
Weighted average remaining
contractual life (years).................................................................................... 9.30 9.76
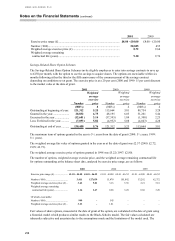
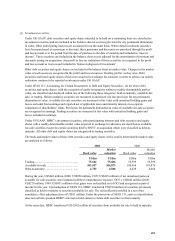
Savings-Related Share Option Schemes
The Savings-Related Share Option Schemes invite eligible employees to enter into savings contracts to save up
to £250 per month, with the option to use the savings to acquire shares. The options are exercisable within six
months following either the third or the fifth anniversary of the commencement of the savings contract
depending on conditions set at grant. The exercise price is at a 20 per cent (2000 and 1999: 15 per cent) discount
to the market value at the date of grant.
2001 2000 1999
Number
Wei
g
hte
d
average
exercise
price Number
Weighte
d
average
exercise
price Number
Weighte
d
average
exercise
price
(000’s) £ (000’ s) £ (000’ s) £
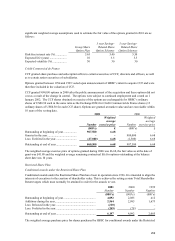
Outstanding at beginning of year . 121,312 5.25 115,664 3.81 89,754 3.28
Granted in the year....................... 28,832 6.75 48,195 6.03 31,261 5.44
Exercised in the year.................... (12,601) 3.14 (37,595) 1.84 (1,308) 2.23
Less: Forfeited in the year............ (7,093) 5.82 (4,952) 5.08 (4,043) 4.28
Outstanding at end of year ........... 130,450 5.76 121,312 5.25 115,664 3.81
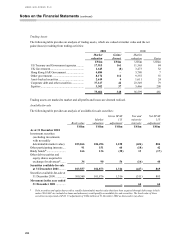
The maximum term of options granted in the year is 51/2 years from the date of grant (2000: 51/2 years; 1999:
51/2 years).
The weighted average fair value of options granted in the year as at the date of grant was £2.57 (2000: £2.72;
1999: £2.75).
The weighted average exercise price of options granted in 1998 was £5.22 (1997: £2.80).
The number of options, weighted average exercise price, and the weighted average remaining contractual life
for options outstanding at the balance sheet date, analysed by exercise price range, are as follows:
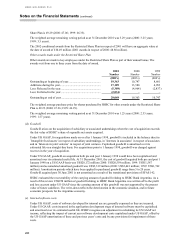
2001 2000 1999
Exercise price range (£) ..................... £1.81 - £4.00 £4.01 - £6.52 £1.81 - £4.00 £4.01 - £6.52 £1.81 - £4.00 £4.01 - £6.52
Number (‘000) ................................... 3,411 127,039 15,470 105,842 53,292 62,372
Weighted average exercise price (£) .. 3.62 5.81 3.16 5.56 2.21 5.18
Weighted average remaining
contractual life (years)...................... 1.16 2.47 0.68 3.28 0.68 3.49
Of which exercisable:
Number (‘000) ................................... 999 – 543 – – –
Weighted average exercise price (£) .. 3.23 – 1.81 – – –
Fair values of share options, measured at the date of grant of the option, are calculated at the date of grant using
a binomial model which produces similar results to the Black-Scholes model. The fair values calculated are
inherently subjective and uncertain due to the assumptions made and the limitations of the model used. The