HSBC 2001 Annual Report Download - page 63
Download and view the complete annual report
Please find page 63 of the 2001 HSBC annual report below. You can navigate through the pages in the report by either clicking on the pages listed below, or by using the keyword search tool below to find specific information within the annual report.-
 1
1 -
2
-
3
-
4
-
5
-
6
-
7
-
8
-
9
-
10
-
11
-
12
-
13
-
14
-
15
-
16
-
17
-
18
-
19
-
20
-
21
-
22
-
23
-
24
-
25
-
26
-
27
-
28
-
29
-
30
-
31
-
32
-
33
-
34
-
35
-
36
-
37
-
38
-
39
-
40
-
41
-
42
-
43
-
44
-
45
-
46
-
47
-
48
-
49
-
50
-
51
-
52
-
 53
53 -
 54
54 -
 55
55 -
 56
56 -
 57
57 -
 58
58 -
 59
59 -
 60
60 -
 61
61 -
 62
62 -
 63
63 -
 64
64 -
 65
65 -
 66
66 -
 67
67 -
 68
68 -
 69
69 -
 70
70 -
 71
71 -
 72
72 -
 73
73 -
74
-
75
-
76
-
77
-
78
-
79
-
80
-
81
-
82
-
83
-
84
-
85
-
86
-
87
-
88
-
89
-
90
-
91
-
92
-
93
-
94
-
95
-
96
-
97
-
98
-
99
-
100
-
101
-
102
-
103
-
104
-
105
-
106
-
107
-
108
-
109
-
110
-
111
-
112
-
113
-
114
-
115
-
116
-
117
-
118
-
119
-
120
-
121
-
122
-
123
-
124
-
125
-
126
-
127
-
128
-
129
-
130
-
131
-
132
-
133
-
134
-
135
-
136
-
137
-
138
-
139
-
140
-
141
-
142
-
143
-
144
-
145
-
146
-
147
-
148
-
149
-
150
-
151
-
152
-
153
-
154
-
155
-
156
-
157
-
158
-
159
-
160
-
161
-
162
-
163
-
164
-
165
-
166
-
167
-
168
-
169
-
170
-
171
-
172
-
173
-
174
-
175
-
176
-
177
-
178
-
179
-
180
-
181
-
182
-
183
-
184
-
185
-
186
-
187
-
188
-
189
-
190
-
191
-
192
-
193
-
194
-
195
-
196
-
197
-
198
-
199
-
200
-
201
-
202
-
203
-
204
-
205
-
206
-
207
-
208
-
209
-
210
-
211
-
212
-
213
-
214
-
215
-
216
-
217
-
218
-
219
-
220
-
221
-
222
-
223
-
224
-
225
-
226
-
227
-
228
-
229
-
230
-
231
-
232
-
233
-
234
-
235
-
236
-
237
-
238
-
239
-
240
-
241
-
242
-
243
-
244
-
245
-
246
-
247
-
248
-
249
-
250
-
251
-
252
-
253
-
254
-
255
-
256
-
257
-
258
-
259
-
260
-
261
-
262
-
263
-
264
-
265
-
266
-
267
-
268
-
269
-
270
-
271
-
272
-
273
-
274
-
275
-
276
-
277
-
278
-
279
-
280
-
281
-
282
-
283
-
284
 |
 |
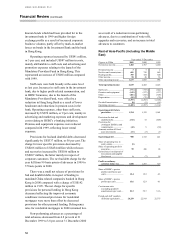
61
in the number of credit cards in issue) following
successful promotional campaigns. As a consequence
the net interest margin improved by 5 basis points to
2.76 per cent. Spread widened by 17 basis points
mainly due to the impact of higher yielding
residential mortgage and credit card loans and lower
cost of funds in a falling interest rate environment.
The contribution from net free funds fell by 12 basis
points reflecting lower interest rates and a reduced
volume of interest free account balances as foreign
investors repatriated surplus funds.
Other operating income of US$91 million was
US$7 million higher than in 2000. The continuing
focus on expanding HSBC’s personal banking
operations generated a 15 per cent increase in credit
card fee income to US$26 million. Higher profits
from bond trading and higher volumes of foreign
exchange transactions resulted in a 13 per cent
increase in dealing profits to US$34 million.
Operating expenses at US$134 million were US$15
million higher than 2000.
Operating expenses, other than staff costs
increased by 31 per cent mainly due to an increase in
marketing initiatives to support strategic
repositioning to focus more on Personal Financial
Services.
Provisions for bad and doubtful debts decreased
by US$26 million to US$7 million. Non-performing
customer loans have decreased by US$126 million or
18 per cent since 31 December 2000 as a result of a
combination of credit upgrades following loan
restructurings, recoveries and write-offs.
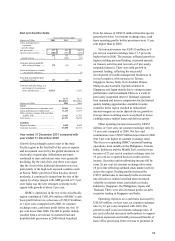
The Middle Eastern operations of HSBC Bank
Middle East benefited from the expansion of fee
income from personal banking business and a lower
charge for bad and doubtful debt provisions. Cash
basis pre-tax profits were US$40 million, 23 per cent
higher than in 2000.
Net interest income was in line with 2000 as the
benefit of increased levels of average interest-earning
assets offset a fall in net interest margin. Intense
competition for the limited quality lending
opportunities resulted in a fall in average customer
advances as scheduled repayments were received. As
a result growth in average interest-earning assets of
US$301 million or 4 per cent, was deposit-driven
and was placed in lower-yielding money market
loans. The 12 basis point fall in net interest margin to
3.84 per cent reflected the more liquid balance sheet
and a lower contribution from net free funds in the
falling interest rate environment.
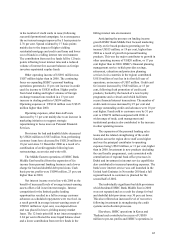
Anticipating the pressure on lending income
growth HSBC Bank Middle East focused marketing
activity on fee based products generating net fee
income US$15 million, or 19 per cent, higher than
2000 as a result of growth in personal banking
products. This was the major contributor to growth in
other operating income of US$20 million, or 17 per
cent higher than in 2000. HSBC’s financial planning
management service (which provides savings,
retirement, education and protection planning
services in six countries in the region) contributed
US$10 million of net fees in its first full year of
operations, an increase of US$7 million. Credit card
fee income increased by US$3 million, or 15 per
cent, following fresh promotion of credit card
products, backed by the launch of a new loyalty
programme and a virtual card which facilitates
secure financial internet transactions. The number of
credit cards in issue increased by 25 per cent and
average outstanding credit card advances were 18 per
cent higher. Funds sold to customers rose by 51 per
cent to US$272 million compared with 2000. A
wider range of trade, cash management and
institutional products also contributed to the increase
in other operating income.
The expansion of the personal banking sales
teams and the related strengthening of the credit
function across the region drove staff costs higher
and was the principal contributor to operating
expenses being US$19 million, or 11 per cent, higher
than in 2000. Investment in new products (including
the card loyalty programme), costs associated with
centralisation of regional back office processes in
Dubai and investment in internet service capabilities
also contributed to increased operating expenses. The
bank’s new internet service was soft launched in the
United Arab Emirates in November 2001and a full
regional launch to customers is planned for the
second half of 2002.
The individually significant bad debt provisions
which burdened HSBC Bank Middle East in 2000
were not repeated and as a result the charge for bad
and doubtful debt provisions was 30 per cent lower.
This also reflected an increased level of recoveries
following investment in strengthening the credit
systems and collection processes.
Elsewhere, HSBC operations in Korea and
Thailand each contributed in excess of US$50
million to pre-tax profits and HSBC’s operations in