HSBC 2001 Annual Report Download - page 66
Download and view the complete annual report
Please find page 66 of the 2001 HSBC annual report below. You can navigate through the pages in the report by either clicking on the pages listed below, or by using the keyword search tool below to find specific information within the annual report.-
 1
1 -
2
-
3
-
4
-
5
-
6
-
7
-
8
-
9
-
10
-
11
-
12
-
13
-
14
-
15
-
16
-
17
-
18
-
19
-
20
-
21
-
22
-
23
-
24
-
25
-
26
-
27
-
28
-
29
-
30
-
31
-
32
-
33
-
34
-
35
-
36
-
37
-
38
-
39
-
40
-
41
-
42
-
43
-
44
-
45
-
46
-
47
-
48
-
49
-
50
-
51
-
52
-
53
-
54
-
55
-
 56
56 -
 57
57 -
 58
58 -
 59
59 -
 60
60 -
 61
61 -
 62
62 -
 63
63 -
 64
64 -
 65
65 -
 66
66 -
 67
67 -
 68
68 -
 69
69 -
 70
70 -
 71
71 -
 72
72 -
 73
73 -
 74
74 -
 75
75 -
 76
76 -
77
-
78
-
79
-
80
-
81
-
82
-
83
-
84
-
85
-
86
-
87
-
88
-
89
-
90
-
91
-
92
-
93
-
94
-
95
-
96
-
97
-
98
-
99
-
100
-
101
-
102
-
103
-
104
-
105
-
106
-
107
-
108
-
109
-
110
-
111
-
112
-
113
-
114
-
115
-
116
-
117
-
118
-
119
-
120
-
121
-
122
-
123
-
124
-
125
-
126
-
127
-
128
-
129
-
130
-
131
-
132
-
133
-
134
-
135
-
136
-
137
-
138
-
139
-
140
-
141
-
142
-
143
-
144
-
145
-
146
-
147
-
148
-
149
-
150
-
151
-
152
-
153
-
154
-
155
-
156
-
157
-
158
-
159
-
160
-
161
-
162
-
163
-
164
-
165
-
166
-
167
-
168
-
169
-
170
-
171
-
172
-
173
-
174
-
175
-
176
-
177
-
178
-
179
-
180
-
181
-
182
-
183
-
184
-
185
-
186
-
187
-
188
-
189
-
190
-
191
-
192
-
193
-
194
-
195
-
196
-
197
-
198
-
199
-
200
-
201
-
202
-
203
-
204
-
205
-
206
-
207
-
208
-
209
-
210
-
211
-
212
-
213
-
214
-
215
-
216
-
217
-
218
-
219
-
220
-
221
-
222
-
223
-
224
-
225
-
226
-
227
-
228
-
229
-
230
-
231
-
232
-
233
-
234
-
235
-
236
-
237
-
238
-
239
-
240
-
241
-
242
-
243
-
244
-
245
-
246
-
247
-
248
-
249
-
250
-
251
-
252
-
253
-
254
-
255
-
256
-
257
-
258
-
259
-
260
-
261
-
262
-
263
-
264
-
265
-
266
-
267
-
268
-
269
-
270
-
271
-
272
-
273
-
274
-
275
-
276
-
277
-
278
-
279
-
280
-
281
-
282
-
283
-
284
 |
 |
HSBC HOLDINGS PLC
Financial Review (continued)
64
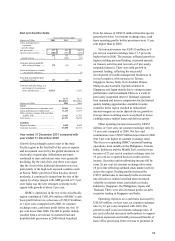
Year ended 31 December
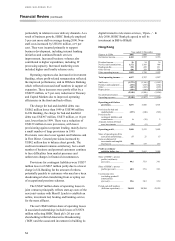
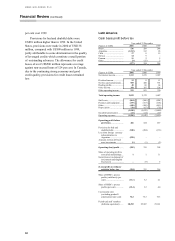
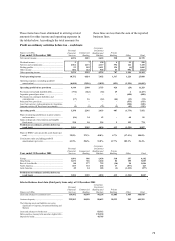
Figures in US$m 2001 2000 1999
Net interest income ............... 2,402 2,152 1,687
Dividend income................... 29 68 12
Net fees and commissions ..... 898 853 593
Dealing profits ...................... 324 218 181
Other income ........................ 205 178 163
Other operating income......... 1,456 1,317 949
Total operating income 3,858 3,469 2,636
Staff costs ............................. (1,412 ) (1,390 ) (884)
Premises and equipmen
t
........ (317) (307) (247 )
Othe
r
.................................... (640) (552) (382 )
Depreciatio
n
.......................... (119) (114) (69 )
(2,488) (2,363 ) (1,582)
Goodwill amortisatio
n
........... (142) (143) (3 )
Operating expenses ............... (2,630) (2,506 ) (1,585)
Operating profit before
provisions ........................ 1,228 963 1,051
Provisions for bad and
doubtful debts................... (287) (147) (108)
Provisions for contingent
liabilities and
commitments....................
–
othe
r
................................... (7) 1(1)
–
Princeton Note settlement . (575 )
–
–
Amounts written off fixed
asset investments.............. (5 )
–
–
Operating profit .................. 354 817 942
Share of operating losses in
joint venture ..................... (7 )
–
–
Share of operating
profit/(losses) in
associates ......................... 5(2) 4
Gains on disposal of
investments and tangible
fixed assets....................... 129 35 13
Profit on ordinary
activities before ta
x
......... 481 850 959
Share of HSBC’ s pre-tax
profits (cash basis)
(per cent).......................... 7.1 9.6 12.0
Share of HSBC’ s pre-tax
profits (cash basis excl.
Princeton) (per cent) ........ 13.8 9.6 12.0
Share of HSBC’ s pre-tax
p
rofits (per cent)............... 6.0 8.7 12.0
Cost:income ratio
(excluding goodwill
amortisation)
(per cent).......................... 64.5 68.1 60.0
Period-end staff numbers
(full-time equivalent
b
asis)................................ 18,518 18,965 19,498
Bad and doubtful debts
Year ended 31 December
Figures in US$m 2001 2000 1999
Loans and advances to
customers
– specific charge
new provisions...................... 402 387 231
releases and recoveries ......... (98) (102) (100 )
304 285 131
–
general (release)................. (17 ) (138) (23)
Customer bad and doubtful
debt charge....................... 287 147 108
Total bad and doubtful debt
charge .............................. 287 147 108
Customer bad debt charge as
a percentage of closing
gross loans and advances 0.39% 0.24% 0.20%
Figures in US$m
At 31
December
2001
At 31
Decembe
r
2000
Assets
Loans and advances to customers (net)... 72,064 60,835
Loans and advances to banks (net).......... 7,864 9,279
Debt securities, treasury bills and other
eligible bills ....................................... 45,200 36,770
Total assets............................................. 136,526 118,053
Liabilities
Deposits by banks................................... 7,602 7,221
Customer accounts.................................. 80,022 68,389
Year ended 31 December 2001 compared with
year ended 31 December 2000
The United States economy continued to deteriorate
in 2001 with investment spending significantly
down, particularly in the technology sectors. Despite
rising unemployment, consumer spending remained
resilient, boosted by lower interest rates as the
Federal Reserve Bank cut short-term interest rates 11
times during the year. Although these sharply lower
interest rates led to rising consumer debt, demand for
corporate loans continued to weaken. For 2001 as a
whole, GDP growth slowed to 1.1 per cent compared
to growth of 4.1 per cent in 2000. Weaker growth
and lower oil prices resulted in a sustained decline in
inflation to just 1.5 per cent by the end of 2001. In
New York State, unemployment has risen from a
cyclical low of 4 per cent early in 2001 to 6 per cent
by the end of 2001.
The year was marked by the tragic events on 11
September. In New York City, HSBC responded
immediately to the tragedy with a number of
donations and programs to assist with the rebuilding
of the community. Although HSBC Bank USA’s
branch at Five World Trade Center was destroyed we
were fortunate that none of our employees was killed
or injured. As contingency plans were activated,