HSBC 2001 Annual Report Download - page 177
Download and view the complete annual report
Please find page 177 of the 2001 HSBC annual report below. You can navigate through the pages in the report by either clicking on the pages listed below, or by using the keyword search tool below to find specific information within the annual report.-
 1
1 -
2
-
3
-
4
-
5
-
6
-
7
-
8
-
9
-
10
-
11
-
12
-
13
-
14
-
15
-
16
-
17
-
18
-
19
-
20
-
21
-
22
-
23
-
24
-
25
-
26
-
27
-
28
-
29
-
30
-
31
-
32
-
33
-
34
-
35
-
36
-
37
-
38
-
39
-
40
-
41
-
42
-
43
-
44
-
45
-
46
-
47
-
48
-
49
-
50
-
51
-
52
-
53
-
54
-
55
-
56
-
57
-
58
-
59
-
60
-
61
-
62
-
63
-
64
-
65
-
66
-
67
-
68
-
69
-
70
-
71
-
72
-
73
-
74
-
75
-
76
-
77
-
78
-
79
-
80
-
81
-
82
-
83
-
84
-
85
-
86
-
87
-
88
-
89
-
90
-
91
-
92
-
93
-
94
-
95
-
96
-
97
-
98
-
99
-
100
-
101
-
102
-
103
-
104
-
105
-
106
-
107
-
108
-
109
-
110
-
111
-
112
-
113
-
114
-
115
-
116
-
117
-
118
-
119
-
120
-
121
-
122
-
123
-
124
-
125
-
126
-
127
-
128
-
129
-
130
-
131
-
132
-
133
-
134
-
135
-
136
-
137
-
138
-
139
-
140
-
141
-
142
-
143
-
144
-
145
-
146
-
147
-
148
-
149
-
150
-
151
-
152
-
153
-
154
-
155
-
156
-
157
-
158
-
159
-
160
-
161
-
162
-
163
-
164
-
165
-
166
-
 167
167 -
 168
168 -
 169
169 -
 170
170 -
 171
171 -
 172
172 -
 173
173 -
 174
174 -
 175
175 -
 176
176 -
 177
177 -
 178
178 -
 179
179 -
 180
180 -
 181
181 -
 182
182 -
 183
183 -
 184
184 -
 185
185 -
 186
186 -
 187
187 -
188
-
189
-
190
-
191
-
192
-
193
-
194
-
195
-
196
-
197
-
198
-
199
-
200
-
201
-
202
-
203
-
204
-
205
-
206
-
207
-
208
-
209
-
210
-
211
-
212
-
213
-
214
-
215
-
216
-
217
-
218
-
219
-
220
-
221
-
222
-
223
-
224
-
225
-
226
-
227
-
228
-
229
-
230
-
231
-
232
-
233
-
234
-
235
-
236
-
237
-
238
-
239
-
240
-
241
-
242
-
243
-
244
-
245
-
246
-
247
-
248
-
249
-
250
-
251
-
252
-
253
-
254
-
255
-
256
-
257
-
258
-
259
-
260
-
261
-
262
-
263
-
264
-
265
-
266
-
267
-
268
-
269
-
270
-
271
-
272
-
273
-
274
-
275
-
276
-
277
-
278
-
279
-
280
-
281
-
282
-
283
-
284
 |
 |

175
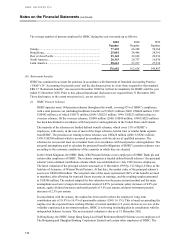
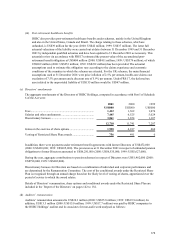
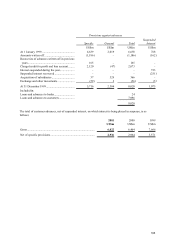
(iii) Post-retirement healthcare benefits
HSBC also provides post-retirement healthcare benefits under schemes, mainly in the United Kingdom
and also in the United States, Canada and Brazil. The charge relating to these schemes, which are
unfunded, is US$39 million for the year (2000: US$42 million; 1999: US$37 million). The latest full
actuarial valuations of the liability were carried out at dates between 31 December 1999 and 31 December
2001 by independent qualified actuaries and have been updated to 31 December 2001 as necessary. This
actuarial review (in accordance with FRS17) estimated the present value of the accumulated post-
retirement benefit obligation at US$404 million (2000: US$411 million; 1999: US$379 million), of which
US$269 million (2000: US$253 million; 1999: US$232 million) has been provided. The actuarial
assumptions used to estimate this obligation vary according to the claims experience and economic
conditions of the countries in which the schemes are situated. For the UK schemes, the main financial
assumptions used at 31 December 2001 were price inflation of 2.5% per annum, health-care claims cost
escalation of 7.5% per annum and a discount rate of 5.9% per annum. Under FRS 17, the deferred tax
asset related to the unprovided liability of US$135 million would be US$47 million.
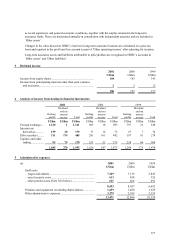
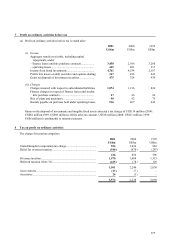
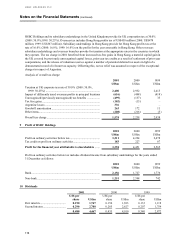
(c) Directors’ emoluments
The aggregate emoluments of the Directors of HSBC Holdings, computed in accordance with Part I of Schedule
6 of the Act were:
2001 2000 1999
US$000 US$000 US$000
Fees ....................................................................................... 1,412 1,362 1,076
Salaries and other emoluments ............................................. 7,445 6,525 5,024
Discretionary bonuses........................................................... 3,861 3,854 1,107
12,718 11,741 7,207
Gains on the exercise of share options.................................. 1,990 4,187 460
Vesting of Restricted Share Plan awards .............................. 756 491 0
In addition, there were payments under retirement benefit agreements with former Directors of US$472,000
(2000: US$483,000; 1999: US$435,000). The provision as at 31 December 2001 in respect of unfunded pension
obligations to former Directors amounted to US$6,281,000 (2000: US$6,535,000; 1999: US$5,627,000).
During the year, aggregate contributions to pension schemes in respect of Directors were US$1,462,000 (2000:
US$798,000; 1999: US$402,000).
Discretionary bonuses for Directors are based on a combination of individual and corporate performance and
are determined by the Remuneration Committee. The cost of the conditional awards under the Restricted Share
Plan is recognised through an annual charge based on the likely level of vesting of shares, apportioned over the
period of service to which the award relates.
Details of Directors’ remuneration, share options and conditional awards under the Restricted Share Plan are
included in the ‘Report of the Directors’ on pages 142 to 154.
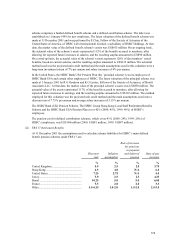
(d) Auditors’ remuneration
Auditors’ remuneration amounted to US$24.3 million (2000: US$25.8 million; 1999: US$19.9 million). In
addition, US$13.3 million (2000: US$15.0 million; 1999: US$17.7 million) was paid by HSBC companies to
the HSBC Holdings’ auditor and its associates for non-audit work analysed as follows: