HSBC 2001 Annual Report Download - page 47
Download and view the complete annual report
Please find page 47 of the 2001 HSBC annual report below. You can navigate through the pages in the report by either clicking on the pages listed below, or by using the keyword search tool below to find specific information within the annual report.-
 1
1 -
2
-
3
-
4
-
5
-
6
-
7
-
8
-
9
-
10
-
11
-
12
-
13
-
14
-
15
-
16
-
17
-
18
-
19
-
20
-
21
-
22
-
23
-
24
-
25
-
26
-
27
-
28
-
29
-
30
-
31
-
32
-
33
-
34
-
35
-
36
-
 37
37 -
 38
38 -
 39
39 -
 40
40 -
 41
41 -
 42
42 -
 43
43 -
 44
44 -
 45
45 -
 46
46 -
 47
47 -
 48
48 -
 49
49 -
 50
50 -
 51
51 -
 52
52 -
 53
53 -
 54
54 -
 55
55 -
 56
56 -
 57
57 -
58
-
59
-
60
-
61
-
62
-
63
-
64
-
65
-
66
-
67
-
68
-
69
-
70
-
71
-
72
-
73
-
74
-
75
-
76
-
77
-
78
-
79
-
80
-
81
-
82
-
83
-
84
-
85
-
86
-
87
-
88
-
89
-
90
-
91
-
92
-
93
-
94
-
95
-
96
-
97
-
98
-
99
-
100
-
101
-
102
-
103
-
104
-
105
-
106
-
107
-
108
-
109
-
110
-
111
-
112
-
113
-
114
-
115
-
116
-
117
-
118
-
119
-
120
-
121
-
122
-
123
-
124
-
125
-
126
-
127
-
128
-
129
-
130
-
131
-
132
-
133
-
134
-
135
-
136
-
137
-
138
-
139
-
140
-
141
-
142
-
143
-
144
-
145
-
146
-
147
-
148
-
149
-
150
-
151
-
152
-
153
-
154
-
155
-
156
-
157
-
158
-
159
-
160
-
161
-
162
-
163
-
164
-
165
-
166
-
167
-
168
-
169
-
170
-
171
-
172
-
173
-
174
-
175
-
176
-
177
-
178
-
179
-
180
-
181
-
182
-
183
-
184
-
185
-
186
-
187
-
188
-
189
-
190
-
191
-
192
-
193
-
194
-
195
-
196
-
197
-
198
-
199
-
200
-
201
-
202
-
203
-
204
-
205
-
206
-
207
-
208
-
209
-
210
-
211
-
212
-
213
-
214
-
215
-
216
-
217
-
218
-
219
-
220
-
221
-
222
-
223
-
224
-
225
-
226
-
227
-
228
-
229
-
230
-
231
-
232
-
233
-
234
-
235
-
236
-
237
-
238
-
239
-
240
-
241
-
242
-
243
-
244
-
245
-
246
-
247
-
248
-
249
-
250
-
251
-
252
-
253
-
254
-
255
-
256
-
257
-
258
-
259
-
260
-
261
-
262
-
263
-
264
-
265
-
266
-
267
-
268
-
269
-
270
-
271
-
272
-
273
-
274
-
275
-
276
-
277
-
278
-
279
-
280
-
281
-
282
-
283
-
284
 |
 |

45
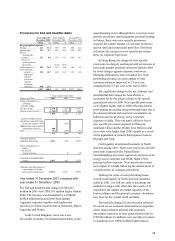
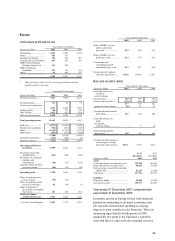
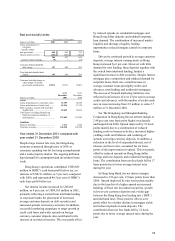
Provisions for bad and doubtful debts as a
percentage of average gross loans and
advances to customers
Europe
Hong
Kong
Rest o
f
Asia
Pacific
North
America
Latin
America Total
%% % % %%
Year ended 31
December 2001
New provisions...... 0.60 0.66 1.86 0.57 6.21 0.86
Releases and
recoveries ......... (0.24 ) (0.36 ) (1.31 ) (0.14 ) (1.90 ) (0.39 )
Net charge for
specific
p
rovisions ......... 0.36 0.30 0.55 0.43 4.31 0.47
Total provisions
charge
d
................. 0.33 0.29 0.55 0.41 13.25 0.65
Amounts written
off net of
recoveries ........... 0.28 0.88 0.93 0.39 4.98 0.61
Year ended 31
December 2000
New provisions...... 0.53 0.68 1.70 0.65 4.72 0.81
Releases and
recoveries ......... (0.28) (0.31) (1.16) (0.17 ) (1.56 ) (0.39)
Net charge for
specific
p
rovisions ......... 0.25 0.37 0.54 0.48 3.16 0.42
Total provisions
charge
d
................. 0.28 0.37 (0.05) 0.25 3.19 0.32
Amounts written
off net of
recoveries ........... 0.35 0.64 1.39 0.45 1.28 0.58
Year ended 31
December 1999
New provisions...... 0.78 1.09 3.48 0.54 3.82 1.24
Releases and
recoveries ......... (0.35) (0.15) (0.83) (0.23 ) (1.30 ) (0.36)
Net charge for
specific
p
rovisions ......... 0.43 0.94 2.65 0.31 2.52 0.88
Total provisions
charge
d
................. 0.45 0.88 2.61 0.25 2.64 0.86
Amounts written
off net of
recoveries ........... 0.30 0.37 0.95 0.28 1.33 0.42
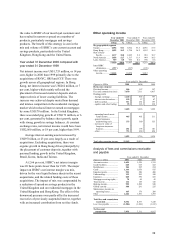
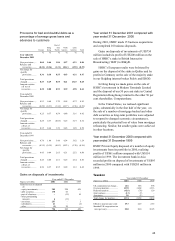
Gains on disposals of investments
Year ended 31 December
Figures in US$m 2001 2000 1999
Gains/(losses) on disposal
of:
–
equity investments............. 305 228 439
–
debt securities.................... 170 66
–
–
part of a business ...............
–
(11) 10
– other participating
interests ........................... 4(11)
–
–
associates........................... 257
–
3
–
subsidiaries........................ 21
–
(2)
–
othe
r
.................................. (3) 30
–
754 302 450
Year ended 31 December 2001 compared with
year ended 31 December 2000
During 2001, HSBC made 15 business acquisitions
and completed 10 business disposals.
Gains on disposals of investments of US$754
million included a profit of US$200 million on the
sale of HSBC’s stake in British Interactive
Broadcasting (‘BiB’ ) to BSkyB.
HSBC’s European results were bolstered by
gains on the disposal of the stake in Quilter and by
profits in Germany on the sale of the majority stake
in our fledgling internet broker Pulsiv and ERGO.
In Hong Kong we made gains on the sale of
HSBC’s investment in Modern Terminals Limited
and the disposal of our 50 per cent stake in Central
Registration Hong Kong Limited to the other 50 per
cent shareholder, Computershare.
In the United States, we realised significant
gains, substantially in the first half of the year, on
the sale of a number of mortgage-backed and other
debt securities as long-term portfolios were adjusted
to respond to changed economic circumstances,
particularly the potential loss of value from mortgage
refinancing. Similar, but smaller gains were achieved
in other locations.
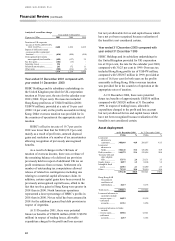
Year ended 31 December 2000 compared with
year ended 31 December 1999
HSBC Private Equity disposed of a number of equity
investments from its portfolio in 2000, realising
profits of US$61 million compared with US$114
million in 1999. The investment bank in Asia
recorded profits on disposal of investments of US$95
million in 2000 compared with US$205 million in
1999.
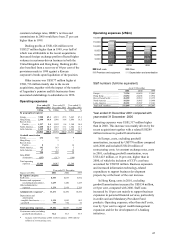
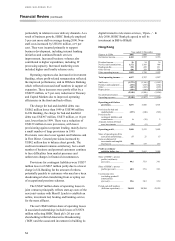
Taxation
Year ended 31 December
Figures in US$m 2001 2000 1999
UK corporation tax charge ... 416 856 596
Overseas taxation ................. 1,570 1,468 1,313
Deferred taxation ................. (425) (78) 129
Joint ventures ....................... (13 ) (7)
–
Associates ............................ 26 (1 )
–
Total charge for taxation ...... 1,574 2,238 2,038
Effective taxation (per cent) 19.7 22.9 25.5
Standard UK corporation tax
rate (per cent) ..................... 30.0 30.0 30.25