HSBC 2001 Annual Report Download - page 46
Download and view the complete annual report
Please find page 46 of the 2001 HSBC annual report below. You can navigate through the pages in the report by either clicking on the pages listed below, or by using the keyword search tool below to find specific information within the annual report.-
 1
1 -
2
-
3
-
4
-
5
-
6
-
7
-
8
-
9
-
10
-
11
-
12
-
13
-
14
-
15
-
16
-
17
-
18
-
19
-
20
-
21
-
22
-
23
-
24
-
25
-
26
-
27
-
28
-
29
-
30
-
31
-
32
-
33
-
34
-
35
-
 36
36 -
 37
37 -
 38
38 -
 39
39 -
 40
40 -
 41
41 -
 42
42 -
 43
43 -
 44
44 -
 45
45 -
 46
46 -
 47
47 -
 48
48 -
 49
49 -
 50
50 -
 51
51 -
 52
52 -
 53
53 -
 54
54 -
 55
55 -
 56
56 -
57
-
58
-
59
-
60
-
61
-
62
-
63
-
64
-
65
-
66
-
67
-
68
-
69
-
70
-
71
-
72
-
73
-
74
-
75
-
76
-
77
-
78
-
79
-
80
-
81
-
82
-
83
-
84
-
85
-
86
-
87
-
88
-
89
-
90
-
91
-
92
-
93
-
94
-
95
-
96
-
97
-
98
-
99
-
100
-
101
-
102
-
103
-
104
-
105
-
106
-
107
-
108
-
109
-
110
-
111
-
112
-
113
-
114
-
115
-
116
-
117
-
118
-
119
-
120
-
121
-
122
-
123
-
124
-
125
-
126
-
127
-
128
-
129
-
130
-
131
-
132
-
133
-
134
-
135
-
136
-
137
-
138
-
139
-
140
-
141
-
142
-
143
-
144
-
145
-
146
-
147
-
148
-
149
-
150
-
151
-
152
-
153
-
154
-
155
-
156
-
157
-
158
-
159
-
160
-
161
-
162
-
163
-
164
-
165
-
166
-
167
-
168
-
169
-
170
-
171
-
172
-
173
-
174
-
175
-
176
-
177
-
178
-
179
-
180
-
181
-
182
-
183
-
184
-
185
-
186
-
187
-
188
-
189
-
190
-
191
-
192
-
193
-
194
-
195
-
196
-
197
-
198
-
199
-
200
-
201
-
202
-
203
-
204
-
205
-
206
-
207
-
208
-
209
-
210
-
211
-
212
-
213
-
214
-
215
-
216
-
217
-
218
-
219
-
220
-
221
-
222
-
223
-
224
-
225
-
226
-
227
-
228
-
229
-
230
-
231
-
232
-
233
-
234
-
235
-
236
-
237
-
238
-
239
-
240
-
241
-
242
-
243
-
244
-
245
-
246
-
247
-
248
-
249
-
250
-
251
-
252
-
253
-
254
-
255
-
256
-
257
-
258
-
259
-
260
-
261
-
262
-
263
-
264
-
265
-
266
-
267
-
268
-
269
-
270
-
271
-
272
-
273
-
274
-
275
-
276
-
277
-
278
-
279
-
280
-
281
-
282
-
283
-
284
 |
 |

HSBC HOLDINGS PLC
Financial Review (continued)
44
2000. In Brazil, provisioning requirements rose by
US$75 million (at constant exchange rates US$80
million) following growth in the lending portfolio.
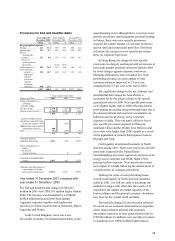
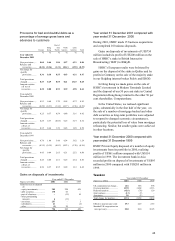
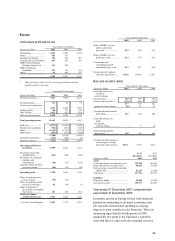
Year ended 31 December 2000 compared with
year ended 31 December 1999
The bad and doubtful debt charge at US$932 million
in 2000 was US$1,141 million lower than in 1999.
The decrease was driven by a sharp fall in new
specific provisions against customer advances,
together with increased releases and recoveries,
including a US$174 million release of the special
general provision raised in 1997 against Asian risk.
New specific provisions against customer
advances declined by 23 per cent to US$2,293
million compared with 1999. This reflected
improved economic conditions and lower interest
rates in Asia and strong liquidity in all major
markets. There was continuing progress in loan
workouts to achieve releases and recoveries.
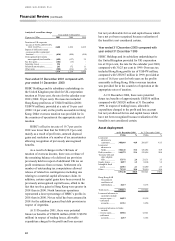
In the United Kingdom, underlying credit
quality remained stable with the lower net charge
reflecting a higher level of recoveries, and no
individually significant provisions in 2000. The
charge for credit losses in France was minimal,
consistent with prior periods and reflective of the
quality of CCF’s business.
Asset quality in Hong Kong reflected the
improved economic conditions, with increased
provisions for residential mortgage loans more than
offset by lower provisions for other personal lending
and corporate accounts. Delinquency rates for
residential mortgages remained low.
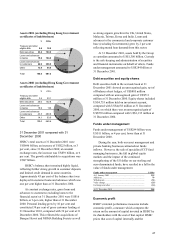
Non-performing customer advances decreased in
the rest of Asia-Pacific due to a combination of
write-offs, credit upgrades and recoveries. The net
charge for bad and doubtful debts for exposures to
mainland China related companies was only US$3
million compared with a charge in 1999 of US$306
million. There were net releases of provisions against
exposures to customers booked in Indonesia,
Thailand and Singapore. In Malaysia, the bad debt
charge rose slightly in the second half of the year due
to lower than expected recoveries caused by delays
in debt restructuring stemming from a weak stock
market; as compared to 1999 the provisions charge in
Malaysia was US$256 million lower. In 2000, 60 per
cent of the special general provision of US$290
million made in 1997 in respect of Asia was released.
In view of the slowdown in the US economy and its
possible implications for the Asian economies as a
whole, the balance of the special general provision
has been transferred to augment the general bad debt
provision.
In North America, although the overall quality
of the portfolio remained sound, non-performing
loans rose slightly due to some deterioration in the
quality of leveraged credits: these constituted a small
portion of outstanding advances.
In Latin America, non-performing loans rose due
to severe economic conditions in Argentina, the
inclusion of new business acquired in Panama and as
a result of the expansion of profitable consumer
lending in Brazil.
At 31 December 2000, non-performing customer
advances represented 3.5 per cent of gross customer
advances compared with 4 per cent at 31 December
1999.
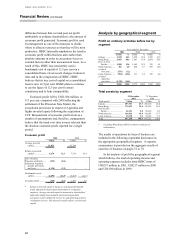
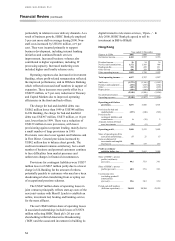
Provisions for bad and doubtful debts as a
percentage of average gross loans and
advances to customers
Average gross loans and advances to customers are
allocated to geographical segment by the location of
the principal operations of the lending subsidiary or,
in the case of The Hongkong and Shanghai Banking
Corporation Limited, HSBC Bank plc, HSBC Bank
Middle East and HSBC Bank USA operations, by
location of the lending branch.
In each of the years, the provisions for bad and
doubtful debts on loans and advances to banks
expressed as a percentage of average gross loans and
advances to banks is nil.