HSBC 2001 Annual Report Download - page 111
Download and view the complete annual report
Please find page 111 of the 2001 HSBC annual report below. You can navigate through the pages in the report by either clicking on the pages listed below, or by using the keyword search tool below to find specific information within the annual report.-
 1
1 -
2
-
3
-
4
-
5
-
6
-
7
-
8
-
9
-
10
-
11
-
12
-
13
-
14
-
15
-
16
-
17
-
18
-
19
-
20
-
21
-
22
-
23
-
24
-
25
-
26
-
27
-
28
-
29
-
30
-
31
-
32
-
33
-
34
-
35
-
36
-
37
-
38
-
39
-
40
-
41
-
42
-
43
-
44
-
45
-
46
-
47
-
48
-
49
-
50
-
51
-
52
-
53
-
54
-
55
-
56
-
57
-
58
-
59
-
60
-
61
-
62
-
63
-
64
-
65
-
66
-
67
-
68
-
69
-
70
-
71
-
72
-
73
-
74
-
75
-
76
-
77
-
78
-
79
-
80
-
81
-
82
-
83
-
84
-
85
-
86
-
87
-
88
-
89
-
90
-
91
-
92
-
93
-
94
-
95
-
96
-
97
-
98
-
99
-
100
-
 101
101 -
 102
102 -
 103
103 -
 104
104 -
 105
105 -
 106
106 -
 107
107 -
 108
108 -
 109
109 -
 110
110 -
 111
111 -
 112
112 -
 113
113 -
 114
114 -
 115
115 -
 116
116 -
 117
117 -
 118
118 -
 119
119 -
 120
120 -
 121
121 -
122
-
123
-
124
-
125
-
126
-
127
-
128
-
129
-
130
-
131
-
132
-
133
-
134
-
135
-
136
-
137
-
138
-
139
-
140
-
141
-
142
-
143
-
144
-
145
-
146
-
147
-
148
-
149
-
150
-
151
-
152
-
153
-
154
-
155
-
156
-
157
-
158
-
159
-
160
-
161
-
162
-
163
-
164
-
165
-
166
-
167
-
168
-
169
-
170
-
171
-
172
-
173
-
174
-
175
-
176
-
177
-
178
-
179
-
180
-
181
-
182
-
183
-
184
-
185
-
186
-
187
-
188
-
189
-
190
-
191
-
192
-
193
-
194
-
195
-
196
-
197
-
198
-
199
-
200
-
201
-
202
-
203
-
204
-
205
-
206
-
207
-
208
-
209
-
210
-
211
-
212
-
213
-
214
-
215
-
216
-
217
-
218
-
219
-
220
-
221
-
222
-
223
-
224
-
225
-
226
-
227
-
228
-
229
-
230
-
231
-
232
-
233
-
234
-
235
-
236
-
237
-
238
-
239
-
240
-
241
-
242
-
243
-
244
-
245
-
246
-
247
-
248
-
249
-
250
-
251
-
252
-
253
-
254
-
255
-
256
-
257
-
258
-
259
-
260
-
261
-
262
-
263
-
264
-
265
-
266
-
267
-
268
-
269
-
270
-
271
-
272
-
273
-
274
-
275
-
276
-
277
-
278
-
279
-
280
-
281
-
282
-
283
-
284
 |
 |

109
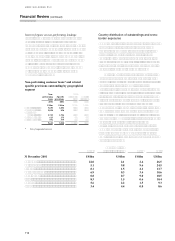
notwithstanding a weaker economic environment.
In Latin America, there was an increase in non-
performing loans in 2001 in local currency terms in
Brazil reflecting both targeted growth in consumer
lending and a generally weaker economy. In
Argentina, there was an increase in non-performing
loans in local currency terms during the year due to
the economic deterioration although this was offset
by all fully provided loans being written off. As at 31
December 2001, the impact of the economic crisis
had not yet caused individual accounts to become
non-performing against contractual terms.
Recognising the likely deterioration in the portfolio
all exposure not already classified as non-performing
has been classified as potential problem loans
against which an additional US$600 million
provision was raised.
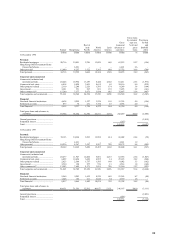
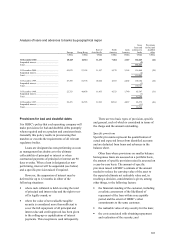
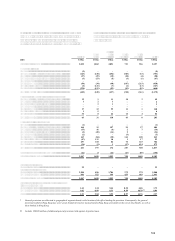
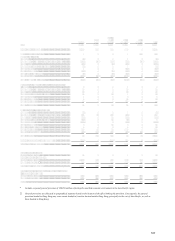
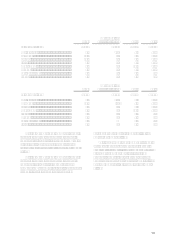
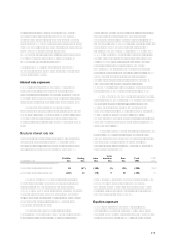
The following table provides an analysis of risk elements in the loan portfolios as at 31 December for the past five
years:
31 December
2001
US$m
31 Decembe
r
2000
US$
m
31 Decembe
r
1999
US$
m
31 Decembe
r
1998
US$
m
31 Decembe
r
1997
US$
m
Loans accounted for on a non-accrual
basis:
Europe.......................................................... 2,052 1,985 1,176 1,092 1,064
Hong Kong................................................... 213 236 163 77 22
Rest of Asia-Pacific...................................... 195 429 435 344 181
North America.............................................. 593 606 550 546 564
Latin America............................................... 429 571 447 355 260
Total non-accrual loans ................................ 3,482 3,827 2,771 2,414 2,091
Loans on which interest has been
accrued but suspended:
Europe.......................................................... 1,553 1,389 1,514 1,243 1,558
Hong Kong................................................... 1,795 2,259 2,898 2,443 597
Rest of Asia-Pacific...................................... 2,497 2,627 3,097 2,691 1,076
North America.............................................. 20 18 18 24 39
Latin America............................................... 162 181 149 48
Total suspended interest loans ...................... 6,027 6,474 7,676 6,449 3,270
Assets acquired in exchange for
advances:
Europe.......................................................... 84 25 27 28 72
Hong Kong................................................... 19 26 72
Rest of Asia-Pacific...................................... 32 24 2
North America.............................................. 14 19 17 22 35
Total assets acquired in exchange for
advances .................................................. 149 94 118 50 107
Total non-performing loans .......................... 9,658 10,395 10,565 8,913 5,468
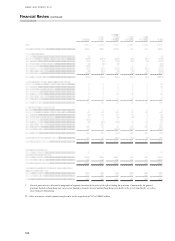
Troubled debt restructurings:
Europe..........................................................
–
22 98
Hong Kong................................................... 381 395 266 187 6
Rest of Asia-Pacific ..................................... 131 231 138 68 38
North America.............................................. 35916
Latin America............................................... 144 144 146 18
Total troubled debt restructurings................. 659 775 559 296 148
Accruing loans contractually past due 90
days or more as to principal or
interest:
Europe.......................................................... 15 11 21 1 49
Hong Kong................................................... 98 76 84 121 91
Rest of Asia-Pacific...................................... 38 66 54 69 79
North America ............................................. 44 64 59 30 57
Latin America............................................... 55 82 58 67 57
Total accruing loans contractually past due
90 days or more ...................................... 250 299 276 288 333
Total risk elements:
Europe.......................................................... 3,704 3,410 2,738 2,386 2,841
Hong Kong................................................... 2,506 2,992 3,483 2,828 716
Rest of Asia-Pacific...................................... 2,893 3,377 3,726 3,172 1,374
North America.............................................. 674 712 653 623 701
Latin America............................................... 790 978 800 496 317
Total risk elements ....................................... 10,567 11,469 11,400 9,497 5,949
Provisions for bad and
doubtful debts as a %
of total risk elements ................................ 77.4 71.5 70.3 70.1 87.0
As at 31 December 2001, there were potential problem loans of US$2,604 million in respect of Argentine loans.