HSBC 2001 Annual Report Download - page 166
Download and view the complete annual report
Please find page 166 of the 2001 HSBC annual report below. You can navigate through the pages in the report by either clicking on the pages listed below, or by using the keyword search tool below to find specific information within the annual report.-
 1
1 -
2
-
3
-
4
-
5
-
6
-
7
-
8
-
9
-
10
-
11
-
12
-
13
-
14
-
15
-
16
-
17
-
18
-
19
-
20
-
21
-
22
-
23
-
24
-
25
-
26
-
27
-
28
-
29
-
30
-
31
-
32
-
33
-
34
-
35
-
36
-
37
-
38
-
39
-
40
-
41
-
42
-
43
-
44
-
45
-
46
-
47
-
48
-
49
-
50
-
51
-
52
-
53
-
54
-
55
-
56
-
57
-
58
-
59
-
60
-
61
-
62
-
63
-
64
-
65
-
66
-
67
-
68
-
69
-
70
-
71
-
72
-
73
-
74
-
75
-
76
-
77
-
78
-
79
-
80
-
81
-
82
-
83
-
84
-
85
-
86
-
87
-
88
-
89
-
90
-
91
-
92
-
93
-
94
-
95
-
96
-
97
-
98
-
99
-
100
-
101
-
102
-
103
-
104
-
105
-
106
-
107
-
108
-
109
-
110
-
111
-
112
-
113
-
114
-
115
-
116
-
117
-
118
-
119
-
120
-
121
-
122
-
123
-
124
-
125
-
126
-
127
-
128
-
129
-
130
-
131
-
132
-
133
-
134
-
135
-
136
-
137
-
138
-
139
-
140
-
141
-
142
-
143
-
144
-
145
-
146
-
147
-
148
-
149
-
150
-
151
-
152
-
153
-
154
-
155
-
 156
156 -
 157
157 -
 158
158 -
 159
159 -
 160
160 -
 161
161 -
 162
162 -
 163
163 -
 164
164 -
 165
165 -
 166
166 -
 167
167 -
 168
168 -
 169
169 -
 170
170 -
 171
171 -
 172
172 -
 173
173 -
 174
174 -
 175
175 -
 176
176 -
177
-
178
-
179
-
180
-
181
-
182
-
183
-
184
-
185
-
186
-
187
-
188
-
189
-
190
-
191
-
192
-
193
-
194
-
195
-
196
-
197
-
198
-
199
-
200
-
201
-
202
-
203
-
204
-
205
-
206
-
207
-
208
-
209
-
210
-
211
-
212
-
213
-
214
-
215
-
216
-
217
-
218
-
219
-
220
-
221
-
222
-
223
-
224
-
225
-
226
-
227
-
228
-
229
-
230
-
231
-
232
-
233
-
234
-
235
-
236
-
237
-
238
-
239
-
240
-
241
-
242
-
243
-
244
-
245
-
246
-
247
-
248
-
249
-
250
-
251
-
252
-
253
-
254
-
255
-
256
-
257
-
258
-
259
-
260
-
261
-
262
-
263
-
264
-
265
-
266
-
267
-
268
-
269
-
270
-
271
-
272
-
273
-
274
-
275
-
276
-
277
-
278
-
279
-
280
-
281
-
282
-
283
-
284
 |
 |

HSBC HOLDINGS PLC
Financial Statements (continued)
164
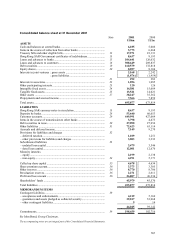
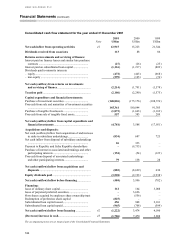
Consolidated cash flow statement for the year ended 31 December 2001
2001 2000 1999
N
ote US$m US$
m
US$
m
Net cash inflow from operating activities 41 12,915 15,223 21,544
Dividends received from associates 113 88 86
Returns on investments and servicing of finance:
Interest paid on finance leases and similar hire purchase
contracts .................................................................... (27) (26) (25)
Interest paid on subordinated loan capital..................... (1,116) (1,217) (809)
Dividends paid to minority interests:
– equity......................................................................... (472) (443) (668)
– non-equity ................................................................. (599) (105) (76)
Net cash (outflow) from returns on investments
and servicing of finance ............................................. (2,214) (1,791) (1,578)
Taxation paid ................................................................. (2,106) (2,290) (1,575)
Capital expenditure and financial investments:
Purchase of investment securities ................................. (148,826) (175,176) (108,376)
Proceeds from sale and maturities of investment securities
................................................................................... 145,361 180,044 91,385
Purchase of tangible fixed assets .................................. (1,873) (1,663) (1,169)
Proceeds from sale of tangible fixed assets................... 557 383 209
Net cash (outflow)/inflow from capital expenditure and
financial investments.................................................. (4,781) 3,588 (17,951)
Acquisitions and disposals:
Net cash (outflow)/inflow from acquisition of and increase
in stake in subsidiary undertakings............................ (834) 687 725
Net cash inflow from disposal of subsidiary undertakings
................................................................................... 26 333
–
Payment to Republic and Safra Republic shareholders –(9,733)
–
Purchase of interest in associated undertakings and other
participating interests ................................................ (154) (54) (123)
Proceeds from disposal of associated undertakings
and other participating interests................................. 79 138 28
Net cash (outflow)/inflow from acquisitions and
disposals ...................................................................... (883) (8,629) 630
Equity dividends paid.................................................... (3,528) (2,193) (1,938)
Net cash (outflow)/inflow before financing .................. (484) 3,996 (782)
Financing:
Issue of ordinary share capital ...................................... 112 164 3,088
Issue of perpetual preferred securities........................... –3,626
–
Own shares acquired by employee share ownership trust –(556)
–
Redemption of preference share capital (825)
–
–
Subordinated loan capital issued................................... 456 948 2,101
Subordinated loan capital repaid................................... (965) (708) (599)
Net cash (outflow)/inflow from financing .................... 42 (1,222) 3,474 4,590
(Decrease)/increase in cash............................................ 43 (1,706) 7,470 3,808
The accompanying notes are an integral part of the Consolidated Financial Statements