HSBC 2001 Annual Report Download - page 105
Download and view the complete annual report
Please find page 105 of the 2001 HSBC annual report below. You can navigate through the pages in the report by either clicking on the pages listed below, or by using the keyword search tool below to find specific information within the annual report.-
 1
1 -
2
-
3
-
4
-
5
-
6
-
7
-
8
-
9
-
10
-
11
-
12
-
13
-
14
-
15
-
16
-
17
-
18
-
19
-
20
-
21
-
22
-
23
-
24
-
25
-
26
-
27
-
28
-
29
-
30
-
31
-
32
-
33
-
34
-
35
-
36
-
37
-
38
-
39
-
40
-
41
-
42
-
43
-
44
-
45
-
46
-
47
-
48
-
49
-
50
-
51
-
52
-
53
-
54
-
55
-
56
-
57
-
58
-
59
-
60
-
61
-
62
-
63
-
64
-
65
-
66
-
67
-
68
-
69
-
70
-
71
-
72
-
73
-
74
-
75
-
76
-
77
-
78
-
79
-
80
-
81
-
82
-
83
-
84
-
85
-
86
-
87
-
88
-
89
-
90
-
91
-
92
-
93
-
94
-
 95
95 -
 96
96 -
 97
97 -
 98
98 -
 99
99 -
 100
100 -
 101
101 -
 102
102 -
 103
103 -
 104
104 -
 105
105 -
 106
106 -
 107
107 -
 108
108 -
 109
109 -
 110
110 -
 111
111 -
 112
112 -
 113
113 -
 114
114 -
 115
115 -
116
-
117
-
118
-
119
-
120
-
121
-
122
-
123
-
124
-
125
-
126
-
127
-
128
-
129
-
130
-
131
-
132
-
133
-
134
-
135
-
136
-
137
-
138
-
139
-
140
-
141
-
142
-
143
-
144
-
145
-
146
-
147
-
148
-
149
-
150
-
151
-
152
-
153
-
154
-
155
-
156
-
157
-
158
-
159
-
160
-
161
-
162
-
163
-
164
-
165
-
166
-
167
-
168
-
169
-
170
-
171
-
172
-
173
-
174
-
175
-
176
-
177
-
178
-
179
-
180
-
181
-
182
-
183
-
184
-
185
-
186
-
187
-
188
-
189
-
190
-
191
-
192
-
193
-
194
-
195
-
196
-
197
-
198
-
199
-
200
-
201
-
202
-
203
-
204
-
205
-
206
-
207
-
208
-
209
-
210
-
211
-
212
-
213
-
214
-
215
-
216
-
217
-
218
-
219
-
220
-
221
-
222
-
223
-
224
-
225
-
226
-
227
-
228
-
229
-
230
-
231
-
232
-
233
-
234
-
235
-
236
-
237
-
238
-
239
-
240
-
241
-
242
-
243
-
244
-
245
-
246
-
247
-
248
-
249
-
250
-
251
-
252
-
253
-
254
-
255
-
256
-
257
-
258
-
259
-
260
-
261
-
262
-
263
-
264
-
265
-
266
-
267
-
268
-
269
-
270
-
271
-
272
-
273
-
274
-
275
-
276
-
277
-
278
-
279
-
280
-
281
-
282
-
283
-
284
 |
 |

103
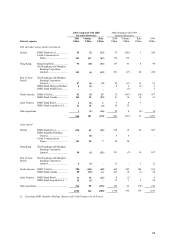
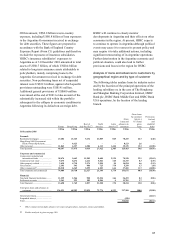
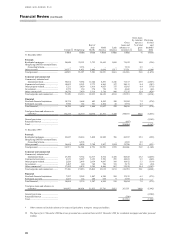
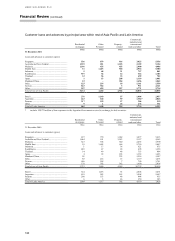
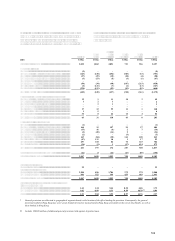
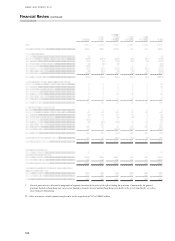
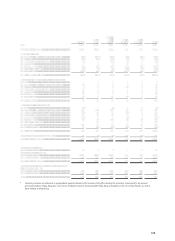
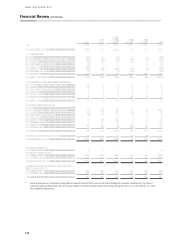
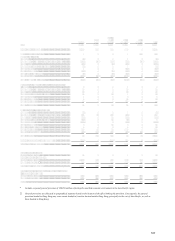
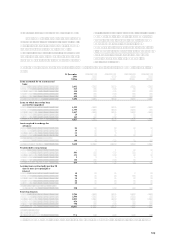
The following tables show details of the movements
in HSBCs provisions for bad and doubtful debts by
location of lending office for each of the past five
years. A discussion of the material movements in the
charge for provisions by region is included within the
analysis of results for geographical segments on
pages 48 to 72.
Euro
p
e
Hon
g
Kon
g
Rest o
f
Asia-
Pacific
North
America
Latin
America Total
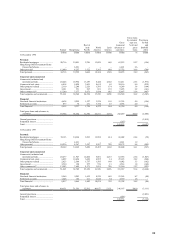
2001 US$m US$m US$m US$m US$m US$m
Provisions at 1 Januar
y
..................................................... 3,025 1,802 2,091 723 556 8,197
Amounts written off:
Banks............................................................................ (5 ) – – – – (5)
Commercial, industrial and international trade.............. (123 ) (238 ) (256 ) (103 ) (33 ) (753 )
Real estate..................................................................... (27 ) (29) (18 ) (10 ) (4) (88 )
Non-bank financial institutions ..................................... (5 ) (53 ) (5 ) (3 ) (1 ) (67 )
Governments................................................................. ––––––
Other commercial.......................................................... (54 ) (34 ) (48) (107 ) (215) (458)
Residential mortgages ................................................... (4 ) (121 ) (7 ) (2 ) (13 ) (147 )
Other personal............................................................... (224 ) (155 ) (93 ) (93 ) (95 ) (660 )
Total amounts written of
f
.............................................. (442 ) (630 ) (427) (318 ) (361 ) (2,178)
Recoveries of amounts written off in previous years:
Commercial, industrial and international trade.............. 12 1 11 18 3 45
Real estate..................................................................... 121
–
–
4
Non-bank financial institutions ..................................... –31––4
Governments................................................................. ––––––
Other commercial.......................................................... 17 12 99 11 1 140
Residential mortgages ................................................... 15–––6
Other personal............................................................... 34 8 26 14 4 86
Total recoveries............................................................. 65 31 138 43 8 285
Charge to profit and loss account:
Banks............................................................................ (1 ) – – – – (1)
Commercial, industrial and international trade.............. 164 15 157 91 57 484
Real estate..................................................................... (35 ) 16 (6 ) 2 7 (16)
Non-bank financial institutions ..................................... (2 ) (20 ) (14 ) 2 – (34 )
Governments................................................................. (2 )
–
–
(3 )
–
(5)
Other commercial.......................................................... 143 (84) (58 ) 141 100 242
Residential mortgages ................................................... (47 ) 111 10 1 17 92
Other personal............................................................... 257 168 82 70 125 702
General provisions ........................................................ (36 ) (9 ) 1 (17 ) 634 573
Total charge .................................................................. 441 197 172 287 940 2,037
Foreign exchange and other movements .......................... (22 ) 8 (22 ) (27 ) (95 ) (158 )
Provisions at 31 Decembe
r
................................................ 3,067 1,408 1,952 708 1,048 8,183
Provisions against banks:
Specific provisions........................................................ 22
–
–
–
–
22
Provisions against customers:
Specific provisions........................................................ 2,204 856 1,786 275 379 5,500
General provisions* ...................................................... 841 552 166 433 669 2,661
Provisions at 31 Decembe
r
................................................ 3,067 1,408 1,952 708 1,048 8,183
Provisions against customers as a % of gross loans and
advances to customers:
Specific provisions........................................................ 1.61 1.24 5.44 0.38 6.06 1.73
General provisions ........................................................ 0.62 0.80 0.51 0.59 10.70 †0.84
Total ................................................................................. 2.23 2.04 5.95 0.97 16.76 2.57
* General provisions are allocated to geographical segments based on the location of the office booking the provision. Consequently, the general
provision booked in Hong Kong may cover assets booked in branches located outside Hong Kong, principally in the rest of Asia-Pacific, as well as
those booked in Hong Kong.
†Includes US$600 million of additional general provisions held against Argentine loans.